The wind, flowing over the whole planet
Thousands of particles carried by the wind as the weather model has it for this hour: fast and bright where it blows hard, slow and faint where the air is calm.
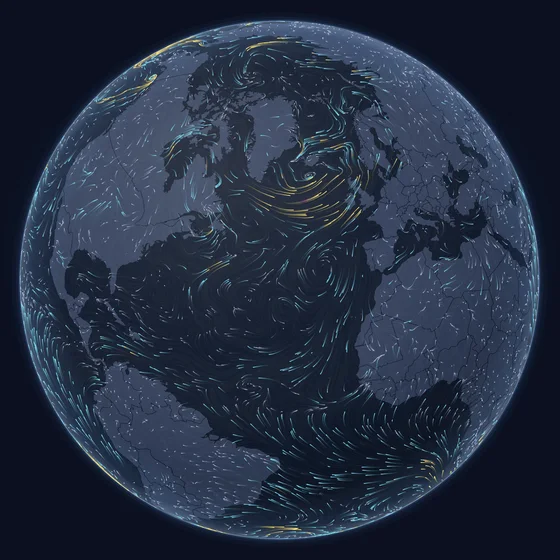
What you are looking at
Each streak is a particle dropped into the wind ten metres above the ground and carried along by it. Together they draw what no weather icon can: the steady trade winds either side of the equator, the great westerly storms circling Antarctica, the spiral of every cyclone, the calm in the middle of a high. The colour is the speed — faint for a breeze, cyan for a fresh wind, yellow for a gale, magenta for a storm. On an equal-area map a storm takes up exactly as much room as it really covers.
How to read it
- Faster, brighter streaks mean stronger wind: magenta is storm force, above about 60 km/h.
- A spiral is a low — a storm or a cyclone — turning anticlockwise north of the equator and clockwise south of it.
- Switch on Storms & hazards with it to see each cyclone's name and forecast track inside its spiral.
Where the data comes from
NOAA's Global Forecast System (GFS, public domain), the wind ten metres above the ground for the model step nearest to now, read through the PacIOOS ERDDAP server of the University of Hawaii. Kartavera fetches a new field every three hours while the layer is open. It is a model's picture of the wind, not a measurement at your door.
Questions
- Where is it windiest right now?
- The figure at the top of this page names the place with the strongest wind on the model's grid at this hour. Most days it is somewhere in the Southern Ocean, in the belt of westerlies sailors call the Roaring Forties — unless a tropical cyclone is out-blowing it.
- Why do storms spin in different directions?
- Because the Earth turns. Air moving towards a low is deflected to the right in the northern hemisphere and to the left in the southern — the Coriolis effect — so lows turn anticlockwise in the north and clockwise in the south. On the equator itself there is no deflection, which is why cyclones never form there.
- Is this the real wind or a forecast?
- It is the weather model's best estimate for this hour: observations from stations, ships, aircraft and satellites are fed into the model every six hours, and the field shown is the step nearest to now. Over open ocean it is usually within a few km/h of what a ship would measure; in mountains and cities the real wind varies far more than a one-degree grid can show.
More of the planet, live
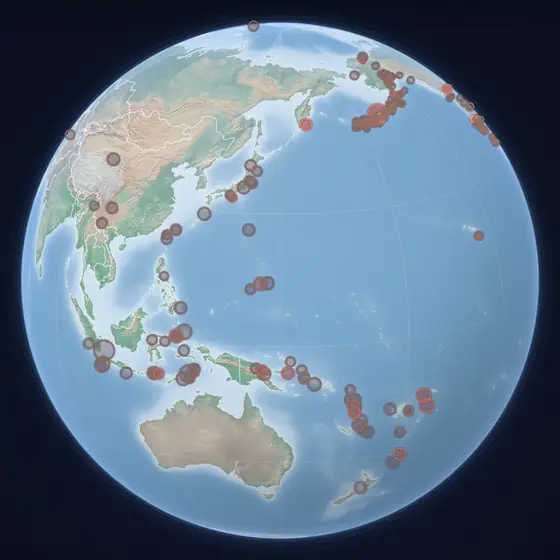 Earthquakes today, on a true-size map
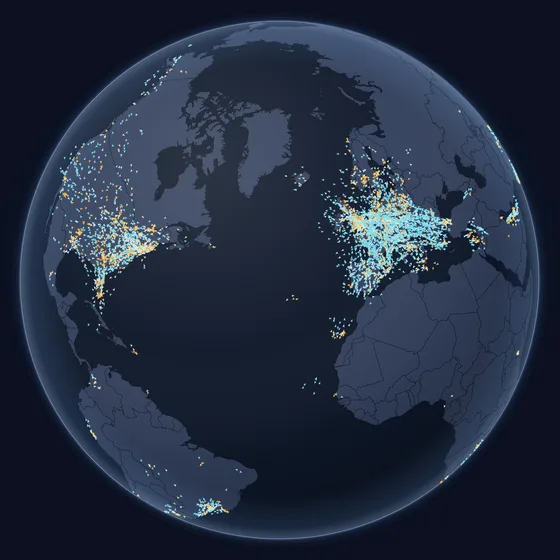 Every aircraft in the air, right now
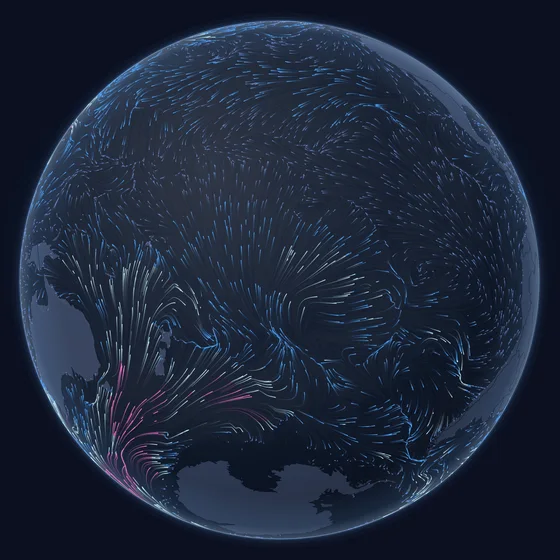 The sea, as high as it is right now
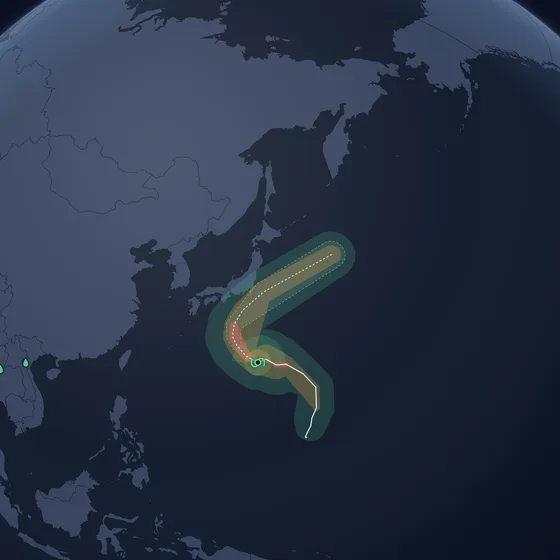 Hurricanes, typhoons and floods, right now
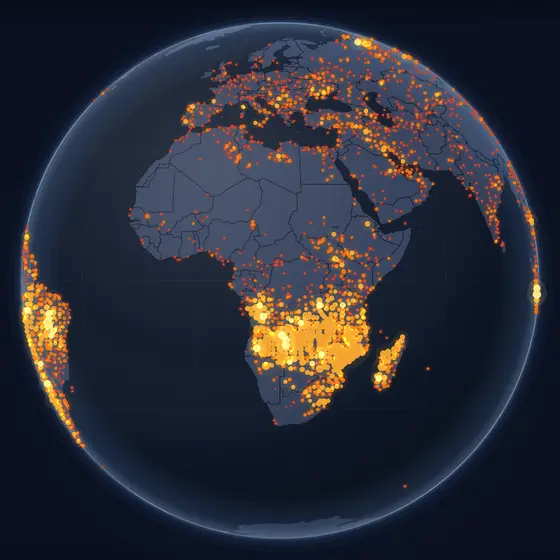 Fires burning now, seen from space
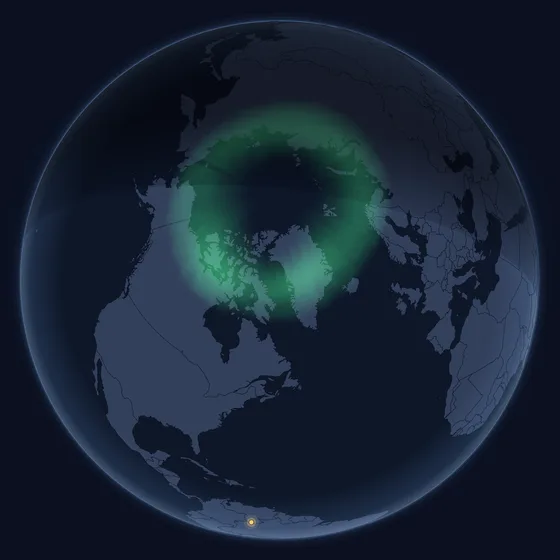 The northern lights, where they are tonight
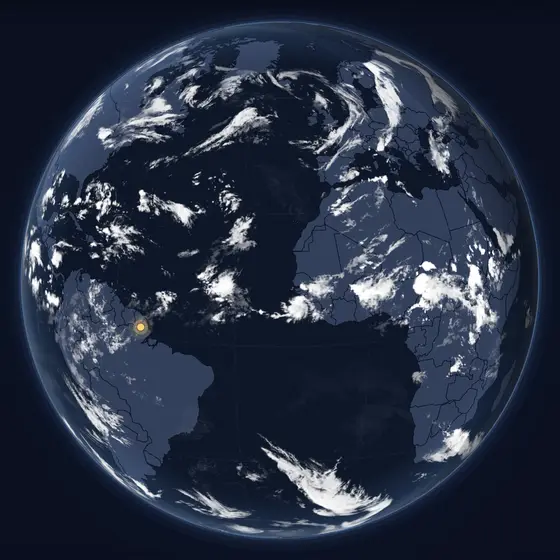 The sky from space, and where it is night
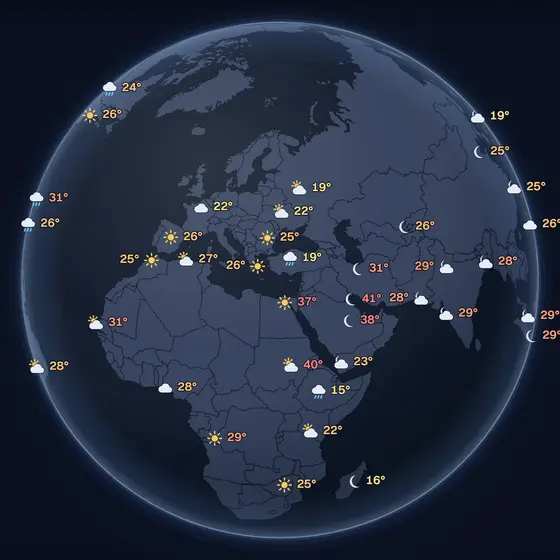 The temperature right now, around the world
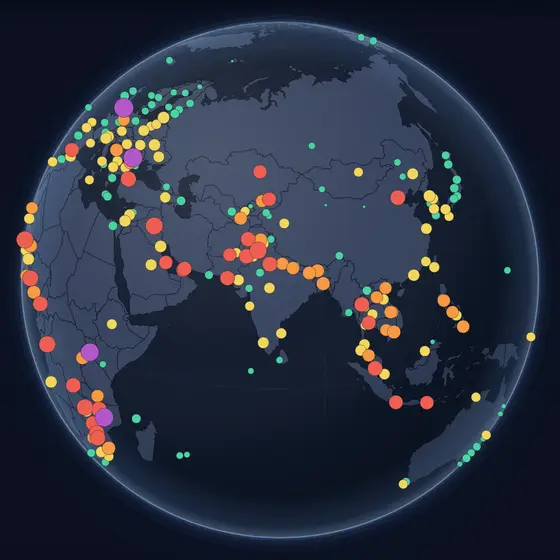 The air right now, where it is measured
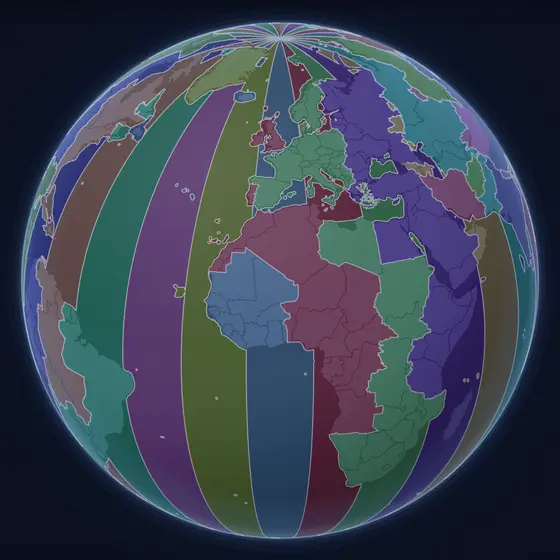 What time it is everywhere, right now
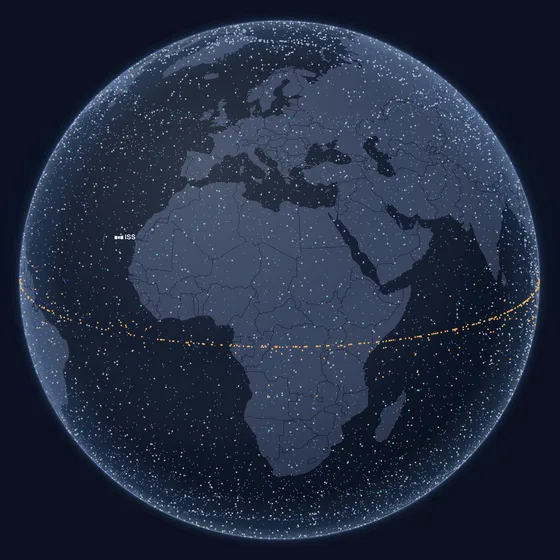 Every satellite, where it is this second
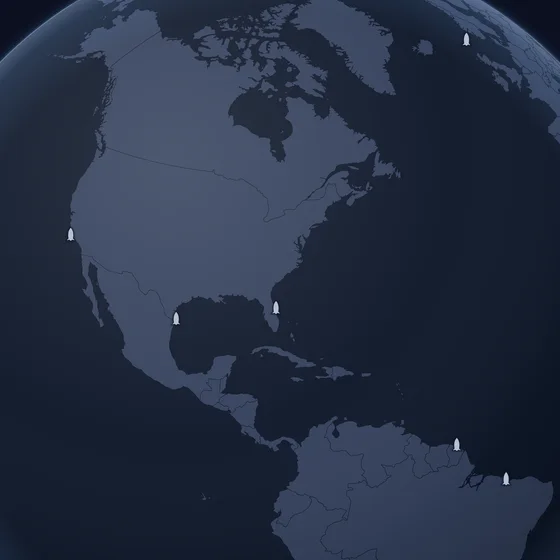 The next rockets to leave the Earth
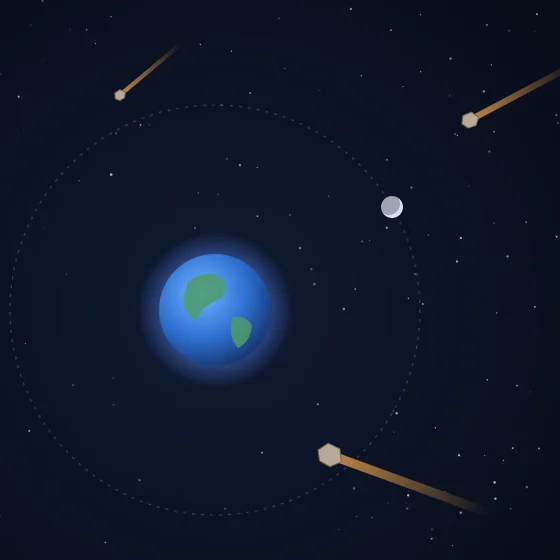 What is passing the Earth, and how close
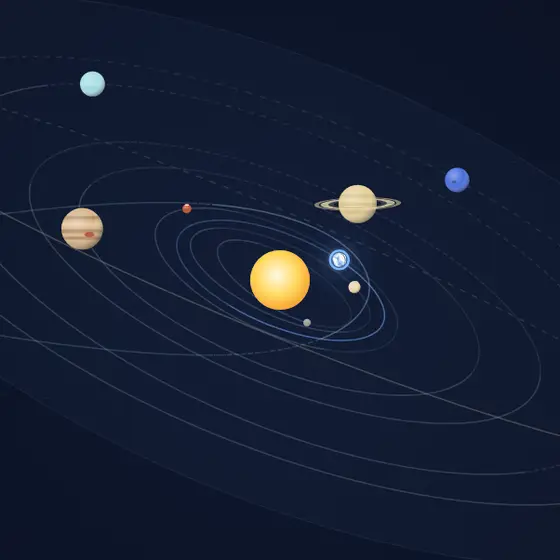 The Solar System, where the planets are today
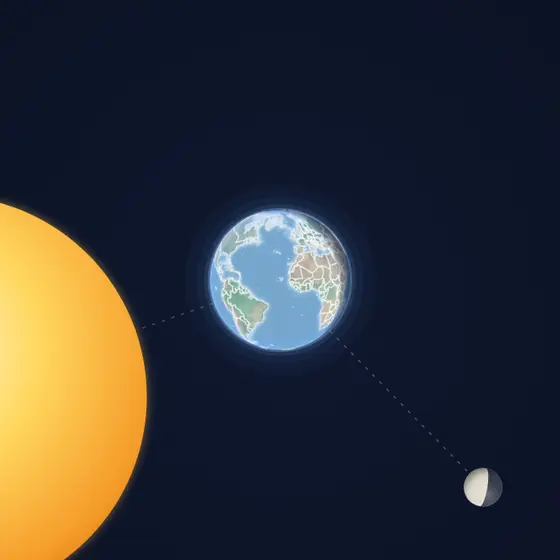 The Earth and the Moon, where they are now