Costa Rica vs Panama
Panama is 45% larger than Costa Rica.
Costa RicaPanamaCosta Rica moved onto Panama · Equal-area projection
0.69×
Costa Rica is 0.69× the area of Panama. Put the other way, Panama is 1.45× the size of Costa Rica.
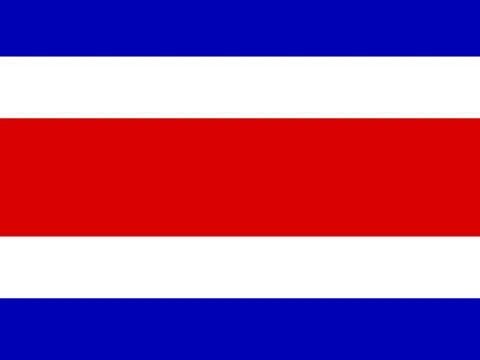 Costa Rica | 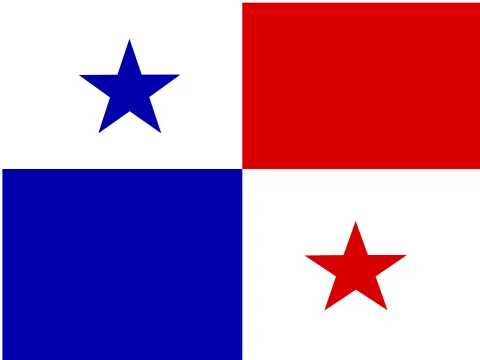 Panama | |
|---|---|---|
| Size | ||
| AreaPanama: 1.45× the area | 51,180 km²#126 of 194 | 74,177 km²#116 of 194 |
| Coastline | Has a coast | Has a coast |
| Land neighbours | 2 | 2 |
| People | ||
| PopulationCosta Rica: 1.13× the population | 5,152,950#125 of 194 · 2025 | 4,571,189#127 of 194 · 2025 |
| DensityCosta Rica: 1.63× the density | 101 / km²#88 of 194 | 62 / km²#124 of 194 |
| Urban populationCosta Rica: 1.2× the urban share | 80%#43 of 192 · 2025 | 66%#85 of 192 · 2025 |
| Fertility ratePanama: 1.6× the births per woman | 1.32 per woman#168 of 192 · 2024 | 2.11 per woman#91 of 192 · 2024 |
| Population growthPanama: 0.77 points higher | +0.45%#133 of 192 · 2025 | +1.22%#80 of 192 · 2025 |
| Birth ratePanama: 1.59× the birth rate | 10.0 per 1,000#140 of 192 · 2024 | 15.9 per 1,000#94 of 192 · 2024 |
| Death rateCosta Rica: 1.14× the death rate | 5.6 per 1,000#154 of 192 · 2024 | 4.9 per 1,000#173 of 192 · 2024 |
| Children under 15Panama: 6.2 points higher | 18.3%#124 of 192 · 2025 | 24.5%#93 of 192 · 2025 |
| People over 65Costa Rica: 3.1 points higher | 12.8%#63 of 192 · 2025 | 9.7%#81 of 192 · 2025 |
| Net migrationPanama: 1.1 per 1,000 higher | +0.2 per 1,000#68 of 192 · 2025 | +1.3 per 1,000#44 of 192 · 2025 |
| Refugees abroadPanama: 1.14× the refugees for its size | 0.07 per 1,000#126 of 190 · 2025 | 0.08 per 1,000#122 of 190 · 2025 |
| Health & education | ||
| Life expectancyCosta Rica: 1.2 years longer | 81.0 years#38 of 192 · 2024 | 79.8 years#42 of 192 · 2024 |
| Infant mortalityPanama: 1.32× the infant mortality | 9.1 per 1,000 births#115 of 191 · 2024 | 12.0 per 1,000 births#100 of 191 · 2024 |
| DoctorsCosta Rica: 1.65× the doctors per person | 2.69 per 1,000#68 of 178 · 2022 | 1.63 per 1,000#91 of 178 · 2022 |
| University enrolment | — | 53.7%#71 of 145 · 2023 |
| Human Development IndexPanama: 0.006 higher | 0.833#61 of 190 · 2023 | 0.839#58 of 190 · 2023 |
| Economy | ||
| GNI per capitaPanama: 1.07× the income per person | $17,930#59 of 185 · 2025 | $19,140#57 of 185 · 2025 |
| GDPCosta Rica: 1.14× the economy | $102.91B2025 | $90.46B2025 |
| Income group | High income | High income |
| GDP per capita (PPP)Panama: 1.3× the output per person | $33,815#65 of 184 · 2025 | $43,902#52 of 184 · 2025 |
| GDP growthCosta Rica: 0.2 points higher | +4.6%#51 of 187 · 2025 | +4.4%#58 of 187 · 2025 |
| InflationCosta Rica: 0.1 points higher | −0.1%#164 of 176 · 2025 | −0.2%#167 of 176 · 2025 |
| UnemploymentPanama: 1.24× the unemployment | 6.8%#60 of 178 · 2025 | 8.4%#47 of 178 · 2025 |
| Extreme povertyPanama: 3.88× the share in extreme poverty | 0.8%#92 of 149 · 2025 | 3.1%#63 of 149 · 2024 |
| Income inequality (Gini)Panama: 4.2 higher | 45.5#14 of 149 · 2025 | 49.7#10 of 149 · 2024 |
| Jobs in agriculturePanama: 4.5 points higher | 11.5% of jobs#103 of 178 · 2025 | 16.0% of jobs#89 of 178 · 2025 |
| Jobs in industryCosta Rica: 1.5 points higher | 18.5% of jobs#98 of 178 · 2025 | 17.0% of jobs#113 of 178 · 2025 |
| Jobs in servicesCosta Rica: 3.0 points higher | 70.0% of jobs#52 of 178 · 2025 | 67.0% of jobs#64 of 178 · 2025 |
| Foreign investmentCosta Rica: 4.4 points higher | 5.4% of GDP#34 of 184 · 2025 | 1.0% of GDP#126 of 184 · 2025 |
| ExportsPanama: 5.6 points higher | 38.8% of GDP#77 of 168 · 2025 | 44.4% of GDP#57 of 168 · 2024 |
| Military spending | 0.0% of GDP#153 of 155 · 2025 | 0.0% of GDP#153 of 155 · 2025 |
| Internet usersCosta Rica: 1.2× the share online | 87%#72 of 184 · 2024 | 73%#113 of 184 · 2024 |
| Mobile subscriptionsPanama: 1.15× the mobile subscriptions | 136 per 100#42 of 191 · 2024 | 157 per 100#22 of 191 · 2023 |
| Energy & environment | ||
| Forest areaPanama: 1.05× the forest share | 59% of land#28 of 192 · 2024 | 62% of land#22 of 192 · 2024 |
| CO₂ per personPanama: 1.68× the CO₂ per person | 1.63 t a year#110 of 185 · 2024 | 2.74 t a year#87 of 185 · 2024 |
| Renewable energyCosta Rica: 6.2 points higher | 34.2%#72 of 190 · 2021 | 28.0%#84 of 190 · 2021 |
| Access to electricityCosta Rica: 3.8 points higher | 99.8%#103 of 192 · 2024 | 96.0%#126 of 192 · 2024 |
| Air pollution (PM2.5)Costa Rica: 1.17× the air pollution | 17.7 µg/m³#99 of 191 · 2023 | 15.1 µg/m³#115 of 191 · 2023 |
| Protected landPanama: 4.8 points higher | 26.6% of land#49 of 191 · 2025 | 31.4% of land#28 of 191 · 2025 |
| Arable landPanama: 3.4 points higher | 3.3% of land#146 of 190 · 2024 | 6.7% of land#117 of 190 · 2024 |
| Water stressCosta Rica: 6.56× the water stress | 5.9%#112 of 176 · 2022 | 0.9%#163 of 176 · 2022 |
| PrecipitationAbout the same rain and snow | 2,926 mm#6 of 180 · 2022 | 2,928 mm#5 of 180 · 2022 |
| Governance & safety | ||
| Political stabilityCosta Rica: 0.98 higher | +1.22#19 of 193 · 2025 | +0.24#83 of 193 · 2025 |
| Control of corruptionCosta Rica: 1.25 higher | +0.69#46 of 193 · 2025 | −0.56#125 of 193 · 2025 |
| Homicide rateCosta Rica: 1.51× the homicide rate | 17.7 per 100,000#19 of 146 · 2023 | 11.7 per 100,000#24 of 146 · 2023 |
| State | ||
| Status | Independent state | Independent state |
| Government | Presidential republic | Presidential republic |
| Member of | OECD | — |
| Capital | San Jose | Panama City |
| Currency | Costa Rican colón (CRC) | United States dollar (USD), Panamanian balboa (PAB) |
| Official languages | Spanish | Spanish |
| Traffic drives | On the right | On the right |
| Time zone | UTC−6 | UTC−5 |
| Calling code | +506 | +507 |
| Region | Central America, North America | Central America, North America |
Area: Wikidata. Population, income, health, economy, environment and governance: World Bank. Human Development Index: UNDP. Government: CIA World Factbook. Ranks among the 194 independent states. All sources
Why the map you grew up with disagrees
On a Mercator map, area grows with distance from the equator. Costa Rica sits at about 10° N and is stretched to 1.03× its true area; Panama at 9° N is stretched to 1.02×. Here the two are distorted about the same amount, so Mercator gets this pair roughly right. The figure above uses the Equal Earth projection, where every square kilometre is drawn the same size.
Questions about this pair
- Is Costa Rica bigger than Panama?
- No. Costa Rica is 31% smaller than Panama. Costa Rica covers 51,180 km² and Panama covers 74,177 km².
- How many times does Costa Rica fit into Panama?
- About 1.4 times: Panama has 1.45× the area of Costa Rica.
- Why do Costa Rica and Panama look different on Google Maps?
- Web maps use the Mercator projection, which stretches area with distance from the equator. Costa Rica is drawn about 1.03× its true area there and Panama about 1.02×. For this pair the distortion is similar, so Mercator gets the comparison roughly right. Kartavera uses Equal Earth, where every square kilometre is drawn the same size.
- Which has more people, Costa Rica or Panama?
- Costa Rica: 5,152,950 people against 4,571,189. Density: Costa Rica 101 per km², Panama 62 per km².
- Which is richer, Costa Rica or Panama?
- By gross national income per person, Panama: $19,140 against $17,930 (World Bank, Atlas method, 2025) — 1.07× as much.
- Where do people live longer, Costa Rica or Panama?
- In Costa Rica: life expectancy at birth is 81.0 years, against 79.8 — 1.2 years longer (World Bank, 2024).
- What kind of government do Costa Rica and Panama have?
- The same form of government, by constitution: presidential republic (CIA World Factbook).