High-income countries
64 countries are in the World Bank’s high-income group. The World Bank’s classification, by GNI per capita (Atlas method), revised every July.
High income35 in Europe, 12 in Asia, 9 in North America, 4 in Oceania, 3 in South America, 1 in Africa
| # | Country | GNI per capita | Population | Continent |
|---|---|---|---|---|
| 1 |  Switzerland Switzerland | $110,330 | 9,092,436 | Europe |
| 2 |  Norway Norway | $97,310 | 5,610,870 | Europe |
| 3 |  Luxembourg Luxembourg | $95,720 | 686,970 | Europe |
| 4 |  Iceland Iceland | $89,220 | 392,404 | Europe |
| 5 |  United States United States | $88,810 | 341,784,857 | North America |
| 6 |  Ireland Ireland | $87,360 | 5,484,367 | Europe |
| 7 |  Singapore Singapore | $81,760 | 6,111,175 | Asia |
| 8 |  Denmark Denmark | $77,190 | 6,009,169 | Europe |
| 9 |  Qatar Qatar | $74,330 | 2,972,215 | Asia |
| 10 |  Netherlands Netherlands | $68,530 | 18,087,633 | Europe |
| 11 |  Australia Australia | $64,120 | 27,614,411 | Oceania |
| 12 |  Sweden Sweden | $63,010 | 10,596,620 | Europe |
| 13 |  Austria Austria | $60,360 | 9,208,163 | Europe |
| 14 |  Germany Germany | $60,200 | 83,491,249 | Europe |
| 15 |  Belgium Belgium | $59,500 | 11,941,781 | Europe |
| 16 |  Canada Canada | $56,420 | 41,651,653 | North America |
| 17 |  Israel Israel | $56,180 | 10,122,800 | Asia |
| 18 | 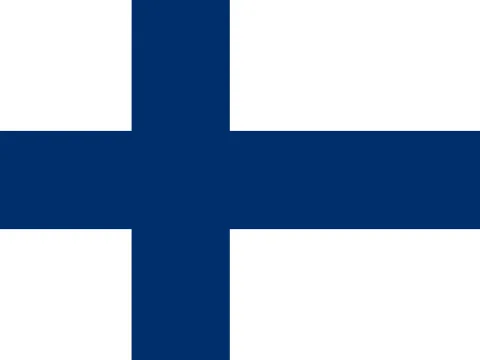 Finland Finland | $55,250 | 5,646,436 | Europe |
| 19 | 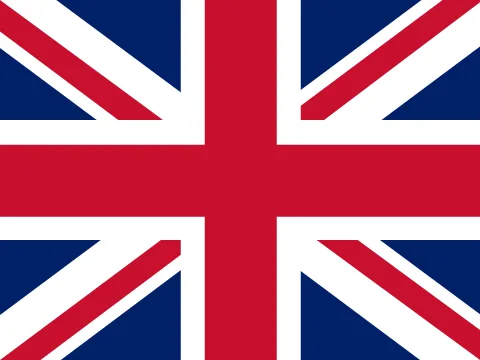 United Kingdom United Kingdom | $54,550 | 69,487,000 | Europe |
| 20 | 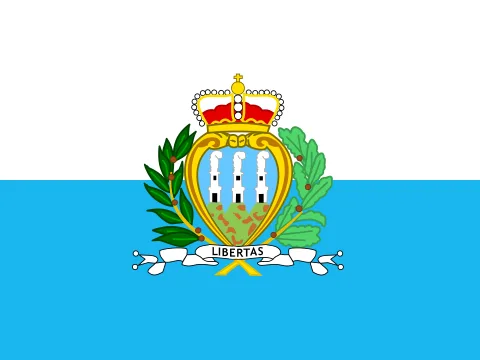 San Marino San Marino | $53,910 | 34,109 | Europe |
| 21 |  Andorra Andorra | $53,230 | 82,904 | Europe |
| 22 | 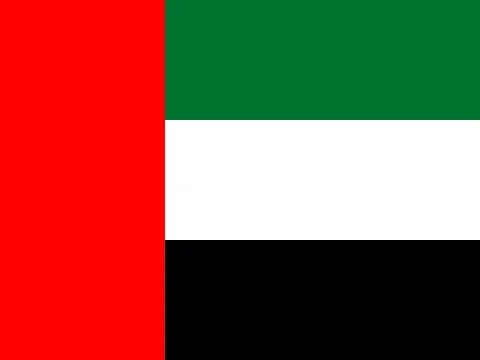 United Arab Emirates United Arab Emirates | $51,550 | 11,513,149 | Asia |
| 23 |  France France | $48,630 | 68,720,337 | Europe |
| 24 |  New Zealand New Zealand | $46,630 | 5,324,700 | Oceania |
| 25 |  Italy Italy | $42,080 | 58,915,656 | Europe |
| 26 |  Malta Malta | $41,440 | 579,704 | Europe |
| 27 |  Kuwait Kuwait | $41,110 | 4,865,298 | Asia |
| 28 |  Japan Japan | $38,340 | 123,366,734 | Asia |
| 29 |  South Korea South Korea | $37,880 | 51,684,564 | Asia |
| 30 |  Spain Spain | $37,120 | 49,355,143 | Europe |
| 31 |  Bahamas Bahamas | $37,020 | 403,033 | North America |
| 32 |  Cyprus Cyprus | $36,110 | 1,370,754 | Asia |
| 33 |  Saudi Arabia Saudi Arabia | $36,070 | 36,973,555 | Asia |
| 34 |  Slovenia Slovenia | $35,520 | 2,130,986 | Europe |
| 35 |  Brunei Brunei | $34,790 | 466,330 | Asia |
| 36 |  Czechia Czechia | $32,960 | 10,886,878 | Europe |
| 37 |  Estonia Estonia | $32,310 | 1,366,475 | Europe |
| 38 |  Lithuania Lithuania | $30,500 | 2,888,774 | Europe |
| 39 |  Portugal Portugal | $29,930 | 10,804,871 | Europe |
| 40 |  Bahrain Bahrain | $28,790 | 1,600,366 | Asia |
| 41 |  Guyana Guyana | $28,470 | 835,986 | South America |
| 42 |  Barbados Barbados | $27,080 | 282,623 | North America |
| 43 |  Slovakia Slovakia | $26,410 | 5,413,813 | Europe |
| 44 |  Poland Poland | $25,520 | 36,435,861 | Europe |
| 45 |  Croatia Croatia | $25,360 | 3,876,200 | Europe |
| 46 |  Greece Greece | $25,360 | 10,413,962 | Europe |
| 47 |  Latvia Latvia | $24,980 | 1,847,785 | Europe |
| 48 | 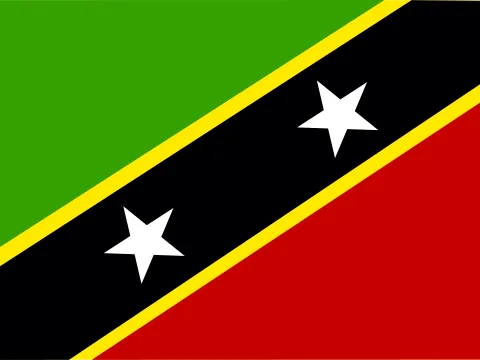 Saint Kitts and Nevis Saint Kitts and Nevis | $24,530 | 46,922 | North America |
| 49 | 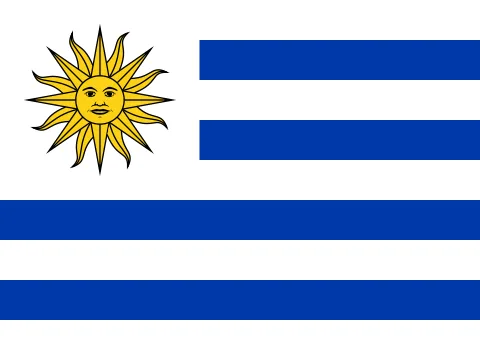 Uruguay Uruguay | $24,020 | 3,384,688 | South America |
| 50 |  Hungary Hungary | $23,850 | 9,514,251 | Europe |
| 51 | 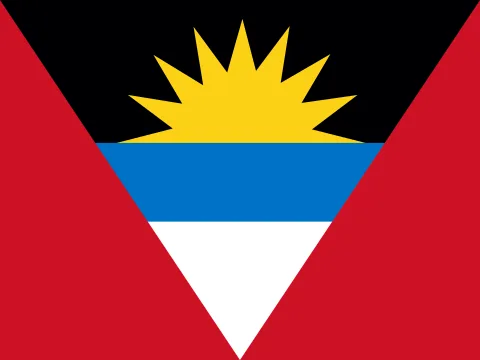 Antigua and Barbuda Antigua and Barbuda | $23,790 | 94,209 | North America |
| 52 |  Nauru Nauru | $20,690 | 12,025 | Oceania |
| 53 | 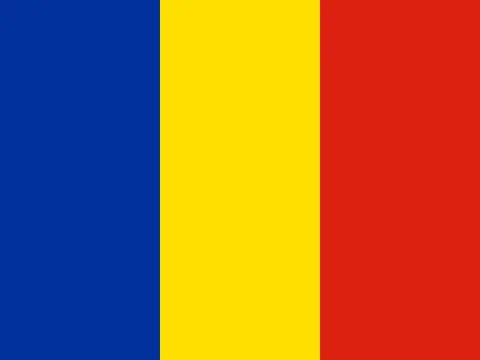 Romania Romania | $20,190 | 19,020,271 | Europe |
| 54 |  Palau Palau | $19,890 | 17,663 | Oceania |
| 55 |  Oman Oman | $19,520 | 5,494,691 | Asia |
| 56 |  Seychelles Seychelles | $19,200 | 122,730 | Africa |
| 57 |  Panama Panama | $19,140 | 4,571,189 | North America |
| 58 |  Trinidad and Tobago Trinidad and Tobago | $18,550 | 1,367,764 | North America |
| 59 |  Costa Rica Costa Rica | $17,930 | 5,152,950 | North America |
| 60 |  Bulgaria Bulgaria | $17,780 | 6,433,302 | Europe |
| 61 |  Chile Chile | $16,960 | 19,859,921 | South America |
| 62 |  Russia Russia | $15,960 | 143,513,328 | Europe |
| 63 |  Liechtenstein Liechtenstein | — | 41,024 | Europe |
| 64 |  Monaco Monaco | — | 38,341 | Europe |
Questions
- How many high-income countries are there?
- 64. 64 countries are in the World Bank’s high-income group. The World Bank’s classification, by GNI per capita (Atlas method), revised every July.
- Which has the highest GNI per capita?
- Switzerland, with $110,330 a person. Then Norway ($97,310 a person).
- Where are they?
- 35 in Europe, 12 in Asia, 9 in North America, 4 in Oceania, 3 in South America, 1 in Africa.
- How is the list made?
- It is a filter over the independent states on Kartavera — high income — using the same figures as the atlas and its rankings. Territories are not included. Open it on the map to change any condition.
Other questions
Figures: area from Wikidata, population, GNI and life expectancy from the World Bank, forms of government from the CIA World Factbook. All sources.