Guinea-Bissau vs Netherlands
Netherlands is 17% larger than Guinea-Bissau.
Guinea-BissauNetherlandsGuinea-Bissau moved onto Netherlands · Equal-area projection
Remote islands and overseas parts not drawn; the figures include them
0.86×
Guinea-Bissau is 0.86× the area of Netherlands. Put the other way, Netherlands is 1.17× the size of Guinea-Bissau.
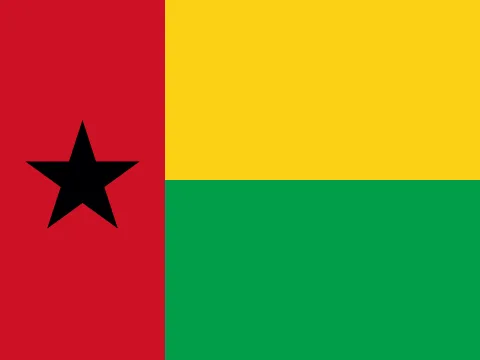 Guinea-Bissau | 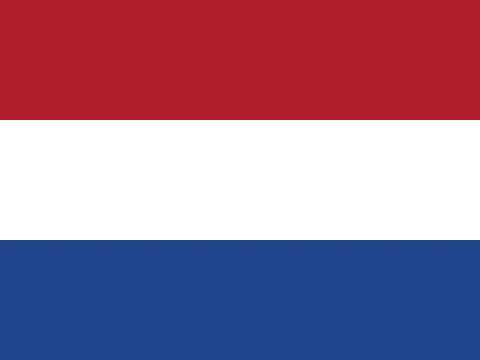 Netherlands | |
|---|---|---|
| Size | ||
| AreaNetherlands: 1.17× the area | 36,125 km²#135 of 194 | 42,201 km²#131 of 194 |
| Coastline | Has a coast | Has a coast |
| Land neighbours | 2 | 2 |
| People | ||
| PopulationNetherlands: 8.04× the population | 2,249,515#145 of 194 · 2025 | 18,087,633#72 of 194 · 2025 |
| DensityNetherlands: 6.88× the density | 62 / km²#123 of 194 | 429 / km²#21 of 194 |
| Urban populationNetherlands: 2.05× the urban share | 47%#134 of 192 · 2025 | 96%#8 of 192 · 2025 |
| Fertility rateGuinea-Bissau: 2.63× the births per woman | 3.76 per woman#34 of 192 · 2024 | 1.43 per woman#151 of 192 · 2024 |
| Population growthGuinea-Bissau: 1.64 points higher | +2.16%#40 of 192 · 2025 | +0.52%#125 of 192 · 2025 |
| Birth rateGuinea-Bissau: 3.22× the birth rate | 29.6 per 1,000#33 of 192 · 2024 | 9.2 per 1,000#154 of 192 · 2024 |
| Death rateNetherlands: 1.37× the death rate | 7.0 per 1,000#102 of 192 · 2024 | 9.6 per 1,000#43 of 192 · 2024 |
| Children under 15Guinea-Bissau: 23.4 points higher | 38.3%#31 of 192 · 2025 | 14.9%#165 of 192 · 2025 |
| People over 65Netherlands: 17.7 points higher | 3.2%#161 of 192 · 2025 | 20.9%#24 of 192 · 2025 |
| Net migrationNetherlands: 6.4 per 1,000 higher | −0.6 per 1,000#109 of 192 · 2025 | +5.8 per 1,000#15 of 192 · 2025 |
| Refugees abroadGuinea-Bissau: 80× the refugees for its size | 0.80 per 1,000#65 of 190 · 2025 | 0.01 per 1,000#155 of 190 · 2025 |
| Health & education | ||
| Life expectancyNetherlands: 17.7 years longer | 64.3 years#167 of 192 · 2024 | 82.0 years#29 of 192 · 2024 |
| Infant mortalityGuinea-Bissau: 12.4× the infant mortality | 42.1 per 1,000 births#25 of 191 · 2024 | 3.4 per 1,000 births#159 of 191 · 2024 |
| DoctorsNetherlands: 15.5× the doctors per person | 0.25 per 1,000#142 of 178 · 2022 | 3.88 per 1,000#34 of 178 · 2022 |
| University enrolment | — | 86.6%#15 of 145 · 2023 |
| Human Development IndexNetherlands: 0.441 higher | 0.514#171 of 190 · 2023 | 0.955#8 of 190 · 2023 |
| Economy | ||
| GNI per capitaNetherlands: 62.9× the income per person | $1,090#169 of 185 · 2025 | $68,530#10 of 185 · 2025 |
| GDPNetherlands: 527× the economy | $2.53B2025 | $1.33T2025 |
| Income group | Low income | High income |
| GDP per capita (PPP)Netherlands: 26.5× the output per person | $3,293#168 of 184 · 2025 | $87,320#10 of 184 · 2025 |
| GDP growthGuinea-Bissau: 4.0 points higher | +5.8%#35 of 187 · 2025 | +1.8%#137 of 187 · 2025 |
| InflationNetherlands: 2.3 points higher | +0.9%#144 of 176 · 2025 | +3.2%#86 of 176 · 2025 |
| UnemploymentNetherlands: 1.44× the unemployment | 2.7%#149 of 178 · 2025 | 3.9%#114 of 178 · 2025 |
| Extreme povertyGuinea-Bissau: 399× the share in extreme poverty | 39.9%#19 of 149 · 2021 | 0.1%#126 of 149 · 2021 |
| Income inequality (Gini)Guinea-Bissau: 7.7 higher | 33.4#90 of 149 · 2021 | 25.7#142 of 149 · 2021 |
| Jobs in agricultureGuinea-Bissau: 59.4 points higher | 61.1% of jobs#13 of 178 · 2025 | 1.7% of jobs#161 of 178 · 2025 |
| Jobs in industryNetherlands: 4.1 points higher | 9.7% of jobs#158 of 178 · 2025 | 13.8% of jobs#145 of 178 · 2025 |
| Jobs in servicesNetherlands: 55.3 points higher | 29.2% of jobs#166 of 178 · 2025 | 84.5% of jobs#4 of 178 · 2025 |
| Foreign investmentGuinea-Bissau: 1.0 points higher | 1.3% of GDP#117 of 184 · 2025 | 0.3% of GDP#154 of 184 · 2025 |
| ExportsNetherlands: 66.8 points higher | 13.9% of GDP#152 of 168 · 2025 | 80.7% of GDP#12 of 168 · 2025 |
| Military spendingNetherlands: 2.46× the military spending | 0.9% of GDP#121 of 155 · 2025 | 2.2% of GDP#52 of 155 · 2025 |
| Internet usersNetherlands: 3.26× the share online | 30%#166 of 184 · 2024 | 97%#17 of 184 · 2024 |
| Mobile subscriptionsGuinea-Bissau: 1.14× the mobile subscriptions | 147 per 100#29 of 191 · 2024 | 129 per 100#54 of 191 · 2024 |
| Energy & environment | ||
| Forest areaGuinea-Bissau: 6.8× the forest share | 75% of land#10 of 192 · 2024 | 11% of land#153 of 192 · 2024 |
| CO₂ per personNetherlands: 41.3× the CO₂ per person | 0.16 t a year#172 of 185 · 2024 | 6.60 t a year#34 of 185 · 2024 |
| Renewable energyGuinea-Bissau: 75.2 points higher | 87.4%#8 of 190 · 2022 | 12.2%#130 of 190 · 2021 |
| Access to electricityNetherlands: 56.3 points higher | 43.7%#179 of 192 · 2024 | 100.0%#1 of 192 · 2024 |
| Air pollution (PM2.5)Guinea-Bissau: 3.76× the air pollution | 32.3 µg/m³#41 of 191 · 2023 | 8.6 µg/m³#164 of 191 · 2023 |
| Protected landGuinea-Bissau: 3.3 points higher | 26.2% of land#51 of 191 · 2025 | 22.9% of land#60 of 191 · 2025 |
| Arable landNetherlands: 13.7 points higher | 16.1% of land#68 of 190 · 2024 | 29.8% of land#29 of 190 · 2024 |
| Water stressNetherlands: 11.1× the water stress | 1.5%#154 of 176 · 2022 | 16.7%#72 of 176 · 2022 |
| PrecipitationGuinea-Bissau: 2.03× the rain and snow | 1,577 mm#53 of 180 · 2022 | 778 mm#108 of 180 · 2022 |
| Governance & safety | ||
| Political stabilityNetherlands: 1.06 higher | −0.53#143 of 193 · 2025 | +0.53#68 of 193 · 2025 |
| Control of corruptionNetherlands: 3.27 higher | −1.40#179 of 193 · 2025 | +1.87#9 of 193 · 2025 |
| Homicide rateGuinea-Bissau: 1.57× the homicide rate | 1.1 per 100,000#99 of 146 · 2017 | 0.7 per 100,000#123 of 146 · 2023 |
| State | ||
| Status | Independent state | Independent state |
| Government | Semi-presidential republic | Constitutional monarchyparliamentary constitutional monarchy; part of the Kingdom of the Netherlands |
| Member of | — | EU, NATO, Euro area, Schengen Area, OECD |
| Capital | Bissau | Amsterdam |
| Currency | West African CFA franc (XOF) | Euro (EUR) |
| Official languages | Portuguese | Dutch |
| Traffic drives | On the right | On the right |
| Time zone | UTC | UTC+1, summer time UTC+2 |
| Calling code | +245 | +31 |
| Region | Western Africa, Africa | Western Europe, Europe |
Area: Wikidata. Population, income, health, economy, environment and governance: World Bank. Human Development Index: UNDP. Government: CIA World Factbook. Ranks among the 194 independent states. All sources
Why the map you grew up with disagrees
On a Mercator map, area grows with distance from the equator. Guinea-Bissau sits at about 12° N and is stretched to 1.05× its true area; Netherlands at 52° N is stretched to 2.67×. That difference is why Netherlands looks so much bigger than it is next to Guinea-Bissau. The figure above uses the Equal Earth projection, where every square kilometre is drawn the same size.
Questions about this pair
- Is Guinea-Bissau bigger than Netherlands?
- No. Guinea-Bissau is 14% smaller than Netherlands. Guinea-Bissau covers 36,125 km² and Netherlands covers 42,201 km².
- How many times does Guinea-Bissau fit into Netherlands?
- About 1.2 times: Netherlands has 1.17× the area of Guinea-Bissau.
- Why do Guinea-Bissau and Netherlands look different on Google Maps?
- Web maps use the Mercator projection, which stretches area with distance from the equator. Guinea-Bissau is drawn about 1.05× its true area there and Netherlands about 2.67×. That is why Netherlands looks so much bigger than it really is next to Guinea-Bissau. Kartavera uses Equal Earth, where every square kilometre is drawn the same size.
- Which has more people, Guinea-Bissau or Netherlands?
- Netherlands: 18,087,633 people against 2,249,515. Density: Guinea-Bissau 62 per km², Netherlands 429 per km².
- Which is richer, Guinea-Bissau or Netherlands?
- By gross national income per person, Netherlands: $68,530 against $1,090 (World Bank, Atlas method, 2025) — 62.9× as much.
- Where do people live longer, Guinea-Bissau or Netherlands?
- In Netherlands: life expectancy at birth is 82.0 years, against 64.3 — 17.7 years longer (World Bank, 2024).
- What kind of government do Guinea-Bissau and Netherlands have?
- By constitution, as the CIA World Factbook describes them — Guinea-Bissau: semi-presidential republic; Netherlands: constitutional monarchy.