Papua New Guinea vs Spain
Spain is 9% larger than Papua New Guinea.
Papua New GuineaSpainPapua New Guinea moved onto Spain · Equal-area projection
Remote islands and overseas parts not drawn; the figures include them
0.91×
Papua New Guinea is 0.91× the area of Spain. Put the other way, Spain is 1.09× the size of Papua New Guinea.
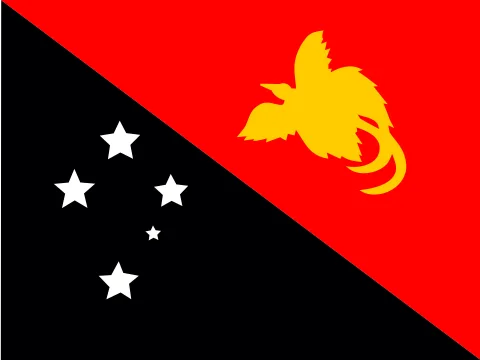 Papua New Guinea | 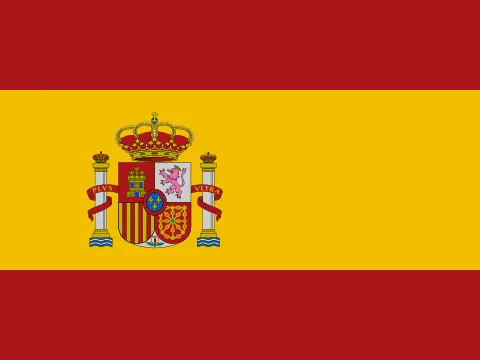 Spain | |
|---|---|---|
| Size | ||
| AreaSpain: 1.09× the area | 462,840 km²#53 of 194 | 505,990 km²#50 of 194 |
| Coastline | Has a coast | Has a coast |
| Land neighbours | 1 | 3 |
| People | ||
| PopulationSpain: 4.59× the population | 10,762,817#92 of 194 · 2025 | 49,355,143#32 of 194 · 2025 |
| DensitySpain: 4.19× the density | 23 / km²#162 of 194 | 98 / km²#93 of 194 |
| Urban populationSpain: 5.09× the urban share | 16%#191 of 192 · 2025 | 81%#40 of 192 · 2025 |
| Fertility ratePapua New Guinea: 2.79× the births per woman | 3.07 per woman#53 of 192 · 2024 | 1.10 per woman#186 of 192 · 2024 |
| Population growthPapua New Guinea: 0.72 points higher | +1.75%#57 of 192 · 2025 | +1.03%#96 of 192 · 2025 |
| Birth ratePapua New Guinea: 3.74× the birth rate | 24.3 per 1,000#54 of 192 · 2024 | 6.5 per 1,000#187 of 192 · 2024 |
| Death rateSpain: 1.35× the death rate | 6.6 per 1,000#117 of 192 · 2024 | 8.9 per 1,000#55 of 192 · 2024 |
| Children under 15Papua New Guinea: 20.5 points higher | 33.1%#55 of 192 · 2025 | 12.6%#186 of 192 · 2025 |
| People over 65Spain: 18.0 points higher | 3.6%#150 of 192 · 2025 | 21.6%#17 of 192 · 2025 |
| Net migrationSpain: 2.0 per 1,000 higher | 0.0 per 1,000#73 of 192 · 2025 | +2.0 per 1,000#38 of 192 · 2025 |
| Refugees abroad | 0.06 per 1,000#129 of 190 · 2025 | 0.00 per 1,000#174 of 190 · 2025 |
| Health & education | ||
| Life expectancySpain: 17.6 years longer | 66.3 years#158 of 192 · 2024 | 83.9 years#10 of 192 · 2024 |
| Infant mortalityPapua New Guinea: 12× the infant mortality | 31.3 per 1,000 births#44 of 191 · 2024 | 2.6 per 1,000 births#172 of 191 · 2024 |
| DoctorsSpain: 71.5× the doctors per person | 0.06 per 1,000#175 of 178 · 2023 | 4.29 per 1,000#24 of 178 · 2022 |
| University enrolment | — | 93.8%#11 of 145 · 2024 |
| Human Development IndexSpain: 0.342 higher | 0.576#157 of 190 · 2023 | 0.918#27 of 190 · 2023 |
| Economy | ||
| GNI per capitaSpain: 12.8× the income per person | $2,890#134 of 185 · 2025 | $37,120#30 of 185 · 2025 |
| GDPSpain: 58.7× the economy | $32.5B2025 | $1.91T2025 |
| Income group | Lower-middle income | High income |
| GDP per capita (PPP)Spain: 11.5× the output per person | $5,215#150 of 184 · 2025 | $59,868#32 of 184 · 2025 |
| GDP growthPapua New Guinea: 2.8 points higher | +5.6%#38 of 187 · 2025 | +2.8%#108 of 187 · 2025 |
| InflationPapua New Guinea: 1.7 points higher | +4.4%#47 of 176 · 2025 | +2.7%#96 of 176 · 2025 |
| UnemploymentSpain: 4.0× the unemployment | 2.6%#154 of 178 · 2025 | 10.4%#33 of 178 · 2025 |
| Extreme poverty | — | 0.8%#92 of 149 · 2023 |
| Income inequality (Gini) | — | 33.4#90 of 149 · 2023 |
| Jobs in agriculturePapua New Guinea: 33.5 points higher | 36.9% of jobs#43 of 178 · 2025 | 3.4% of jobs#144 of 178 · 2025 |
| Jobs in industrySpain: 12.0 points higher | 7.9% of jobs#166 of 178 · 2025 | 19.9% of jobs#79 of 178 · 2025 |
| Jobs in servicesSpain: 21.5 points higher | 55.3% of jobs#98 of 178 · 2025 | 76.8% of jobs#25 of 178 · 2025 |
| Foreign investmentSpain: 5.1 points higher | -3.6% of GDP#181 of 184 · 2025 | 1.5% of GDP#110 of 184 · 2025 |
| Exports | — | 36.6% of GDP#81 of 168 · 2025 |
| Military spendingSpain: 6.09× the military spending | 0.3% of GDP#149 of 155 · 2025 | 2.1% of GDP#55 of 155 · 2025 |
| Internet usersSpain: 5.1× the share online | 19%#175 of 184 · 2024 | 96%#20 of 184 · 2024 |
| Mobile subscriptionsSpain: 3.33× the mobile subscriptions | 39 per 100#187 of 191 · 2024 | 130 per 100#52 of 191 · 2024 |
| Energy & environment | ||
| Forest areaPapua New Guinea: 1.97× the forest share | 75% of land#9 of 192 · 2024 | 38% of land#73 of 192 · 2024 |
| CO₂ per personSpain: 8.67× the CO₂ per person | 0.52 t a year#149 of 185 · 2024 | 4.51 t a year#52 of 185 · 2024 |
| Renewable energyPapua New Guinea: 35.6 points higher | 54.6%#43 of 190 · 2022 | 19.0%#110 of 190 · 2021 |
| Access to electricitySpain: 56.7 points higher | 43.3%#180 of 192 · 2024 | 100.0%#1 of 192 · 2024 |
| Air pollution (PM2.5)Papua New Guinea: 1.4× the air pollution | 14.1 µg/m³#124 of 191 · 2023 | 10.1 µg/m³#154 of 191 · 2023 |
| Protected landSpain: 24.4 points higher | 3.7% of land#173 of 191 · 2025 | 28.1% of land#43 of 191 · 2025 |
| Arable landSpain: 22.1 points higher | 0.7% of land#178 of 190 · 2024 | 22.8% of land#45 of 190 · 2024 |
| Water stressSpain: 433× the water stress | 0.1%#175 of 176 · 2022 | 43.3%#42 of 176 · 2022 |
| PrecipitationPapua New Guinea: 4.94× the rain and snow | 3,142 mm#3 of 180 · 2022 | 636 mm#124 of 180 · 2022 |
| Governance & safety | ||
| Political stabilitySpain: 0.73 higher | −0.55#145 of 193 · 2025 | +0.18#88 of 193 · 2025 |
| Control of corruptionSpain: 1.43 higher | −0.78#140 of 193 · 2025 | +0.65#49 of 193 · 2025 |
| Homicide rate | — | 0.7 per 100,000#123 of 146 · 2023 |
| State | ||
| Status | Independent state | Independent state |
| Government | Constitutional monarchyparliamentary democracy under a constitutional monarchy; a Commonwealth realm | Constitutional monarchyparliamentary constitutional monarchy |
| Member of | — | EU, NATO, Euro area, Schengen Area, OECD |
| Capital | Port Moresby | Madrid |
| Currency | Kina (PGK) | Euro (EUR) |
| Official languages | English, Tok Pisin, Hiri Motu, Papua New Guinean Sign Language | Spanish, Catalan, Basque, Occitan, Galician |
| Traffic drives | On the left | On the right |
| Time zone | UTC+10 · UTC+10 to UTC+11, 2 time zones | UTC+1, summer time UTC+2 · UTC to UTC+1, 2 time zones |
| Calling code | +675 | +34 |
| Region | Melanesia, Oceania | Southern Europe, Europe |
Area: Wikidata. Population, income, health, economy, environment and governance: World Bank. Human Development Index: UNDP. Government: CIA World Factbook. Ranks among the 194 independent states. All sources
Why the map you grew up with disagrees
On a Mercator map, area grows with distance from the equator. Papua New Guinea sits at about 6° S and is stretched to 1.01× its true area; Spain at 40° N is stretched to 1.71×. That difference is why Spain looks so much bigger than it is next to Papua New Guinea. The figure above uses the Equal Earth projection, where every square kilometre is drawn the same size.
Questions about this pair
- Is Papua New Guinea bigger than Spain?
- No. Papua New Guinea is 9% smaller than Spain. Papua New Guinea covers 462,840 km² and Spain covers 505,990 km².
- How many times does Papua New Guinea fit into Spain?
- About 1.1 times: Spain has 1.09× the area of Papua New Guinea.
- Why do Papua New Guinea and Spain look different on Google Maps?
- Web maps use the Mercator projection, which stretches area with distance from the equator. Papua New Guinea is drawn about 1.01× its true area there and Spain about 1.71×. That is why Spain looks so much bigger than it really is next to Papua New Guinea. Kartavera uses Equal Earth, where every square kilometre is drawn the same size.
- Which has more people, Papua New Guinea or Spain?
- Spain: 49,355,143 people against 10,762,817. Density: Papua New Guinea 23 per km², Spain 98 per km².
- Which is richer, Papua New Guinea or Spain?
- By gross national income per person, Spain: $37,120 against $2,890 (World Bank, Atlas method, 2025) — 12.8× as much.
- Where do people live longer, Papua New Guinea or Spain?
- In Spain: life expectancy at birth is 83.9 years, against 66.3 — 17.6 years longer (World Bank, 2024).
- What kind of government do Papua New Guinea and Spain have?
- The same form of government, by constitution: constitutional monarchy (CIA World Factbook).