Countries in Asia by co₂ per person
Carbon dioxide emitted in a year, divided by the population: fossil fuels and industry, without land use change and forestry. 47 countries in Asia, highest first. World Bank, 2024
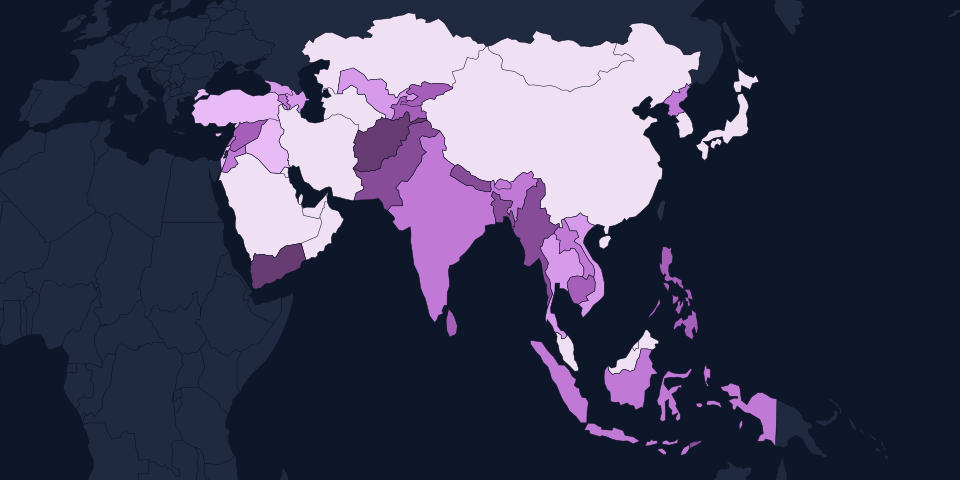
Median country
3.81
half above, half below| # | Country | t per person | Region |
|---|---|---|---|
| 1 |  Qatar Qatar | 47.3 | Western Asia |
| 2 |  Bahrain Bahrain | 23.9 | Western Asia |
| 3 |  Kuwait Kuwait | 23.7 | Western Asia |
| 4 |  Brunei Brunei | 20.2 | South-Eastern Asia |
| 5 |  Oman Oman | 18.6 | Western Asia |
| 6 |  Saudi Arabia Saudi Arabia | 18.5 | Western Asia |
| 7 |  United Arab Emirates United Arab Emirates | 18.3 | Western Asia |
| 8 |  Kazakhstan Kazakhstan | 12.6 | Central Asia |
| 9 |  South Korea South Korea | 11.4 | Eastern Asia |
| 10 |  Turkmenistan Turkmenistan | 10.9 | Central Asia |
| 11 |  Singapore Singapore | 9.75 | South-Eastern Asia |
| 12 |  China China | 9.32 | Eastern Asia |
| 13 |  Iran Iran | 9.05 | Southern Asia |
| 14 |  Malaysia Malaysia | 8.32 | South-Eastern Asia |
| 15 |  Mongolia Mongolia | 7.85 | Eastern Asia |
| 16 |  Japan Japan | 7.84 | Eastern Asia |
| 17 |  Israel Israel | 5.77 | Western Asia |
| 18 |  Cyprus Cyprus | 5.40 | Western Asia |
| 19 |  Turkey Turkey | 5.38 | Western Asia |
| 20 |  Iraq Iraq | 5.18 | Western Asia |
| 21 |  Vietnam Vietnam | 4.27 | South-Eastern Asia |
| 22 |  Uzbekistan Uzbekistan | 4.09 | Central Asia |
| 23 |  Thailand Thailand | 3.96 | South-Eastern Asia |
| 24 |  Azerbaijan Azerbaijan | 3.81 | Western Asia |
| 25 |  Maldives Maldives | 3.57 | Southern Asia |
| 26 |  Georgia Georgia | 3.53 | Western Asia |
| 27 |  Laos Laos | 3.35 | South-Eastern Asia |
| 28 |  Indonesia Indonesia | 2.87 | South-Eastern Asia |
| 29 |  North Korea North Korea | 2.50 | Eastern Asia |
| 30 |  Armenia Armenia | 2.47 | Western Asia |
| 31 |  India India | 2.17 | Southern Asia |
| 32 |  Jordan Jordan | 2.09 | Western Asia |
| 33 |  Bhutan Bhutan | 2.01 | Southern Asia |
| 34 |  Lebanon Lebanon | 1.90 | Western Asia |
| 35 |  Philippines Philippines | 1.50 | South-Eastern Asia |
| 36 |  Kyrgyzstan Kyrgyzstan | 1.49 | Central Asia |
| 37 |  Syria Syria | 1.27 | Western Asia |
| 38 |  Cambodia Cambodia | 1.10 | South-Eastern Asia |
| 39 |  Sri Lanka Sri Lanka | 1.06 | Southern Asia |
| 40 |  Tajikistan Tajikistan | 0.92 | Central Asia |
| 41 |  Pakistan Pakistan | 0.81 | Southern Asia |
| 42 |  Bangladesh Bangladesh | 0.72 | Southern Asia |
| 43 |  Myanmar Myanmar | 0.58 | South-Eastern Asia |
| 44 |  Nepal Nepal | 0.54 | Southern Asia |
| 45 |  Timor-Leste Timor-Leste | 0.50 | South-Eastern Asia |
| 46 |  Afghanistan Afghanistan | 0.28 | Southern Asia |
| 47 |  Yemen Yemen | 0.26 | Western Asia |
No World Bank figure for Taiwan.
Territories and other places
Not ranked: dependencies of the states above, places whose status is disputed. Highest first.


Questions
- Which country in Asia has the highest CO₂ emissions per person?
- Qatar has the highest CO₂ emissions per person in Asia: 47.3 tonnes a person (2024). Next come Bahrain (23.9 tonnes a person) and Kuwait (23.7 tonnes a person).
- Which country in Asia has the lowest CO₂ emissions per person?
- Yemen, with 0.26 tonnes a person (2024).
- What is the typical co₂ per person of a country in Asia?
- The median of the 47 countries in Asia is 3.81 tonnes a person: half are above it, half below. The median, not the average, because a few countries at the top would drag an average far above almost everyone.
- Where do the figures come from?
- Carbon dioxide emitted in a year, divided by the population: fossil fuels and industry, without land use change and forestry. Source: World Bank, 2024. Only independent states are ranked; territories are listed separately. A country’s continent follows Natural Earth; the handful of island states it files under the open ocean are placed by their UN subregion.
Source: World Bank (CC BY 4.0). Figures more than 5 years older than the newest are left out rather than shown beside current ones. Countries sharing a value share a rank. All sources.