Countries in Asia by control of corruption
How well public power is kept from being used for private gain, petty or grand, as the World Bank’s Worldwide Governance Indicators estimate it from surveys and experts: about −2.5 (most corrupt) to +2.5 (least). 48 countries in Asia, highest first. World Bank, 2024
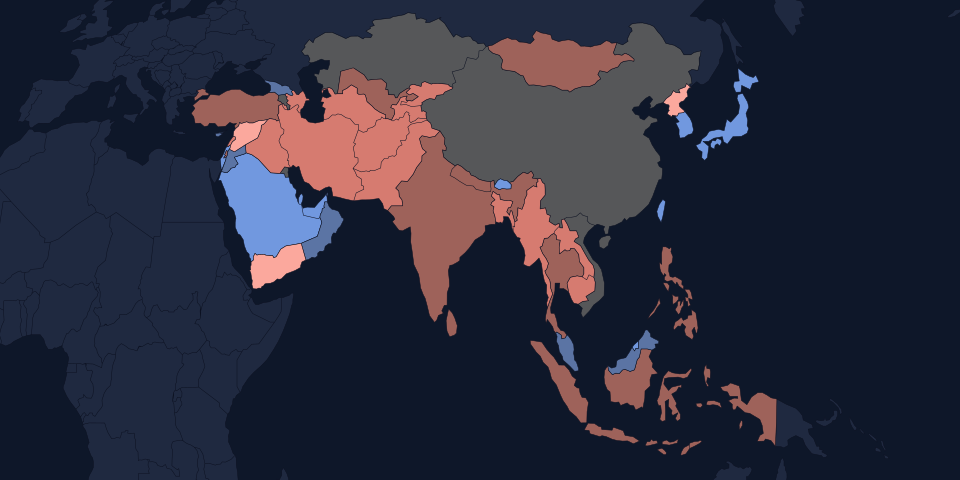
Median country
−0.38
half above, half below| # | Country | Estimate | Region |
|---|---|---|---|
| 1 |  Singapore Singapore | +1.97 | South-Eastern Asia |
| 2 |  Bhutan Bhutan | +1.47 | Southern Asia |
| 3 |  Japan Japan | +1.36 | Eastern Asia |
| 4 |  Brunei Brunei | +1.19 | South-Eastern Asia |
| 5 |  Taiwan Taiwan | +1.18 | Eastern Asia |
| 6 |  United Arab Emirates United Arab Emirates | +1.17 | Western Asia |
| =7 |  Israel Israel | +0.85 | Western Asia |
| =7 |  South Korea South Korea | +0.85 | Eastern Asia |
| =9 |  Qatar Qatar | +0.75 | Western Asia |
| =9 |  Saudi Arabia Saudi Arabia | +0.75 | Western Asia |
| 11 |  Cyprus Cyprus | +0.53 | Western Asia |
| 12 |  Oman Oman | +0.51 | Western Asia |
| 13 |  Malaysia Malaysia | +0.50 | South-Eastern Asia |
| 14 |  Georgia Georgia | +0.38 | Western Asia |
| 15 |  Jordan Jordan | +0.27 | Western Asia |
| 16 |  Bahrain Bahrain | +0.25 | Western Asia |
| 17 |  Kuwait Kuwait | +0.22 | Western Asia |
| 18 |  Armenia Armenia | +0.14 | Western Asia |
| 19 |  China China | +0.09 | Eastern Asia |
| 20 |  Kazakhstan Kazakhstan | −0.07 | Central Asia |
| 21 |  Vietnam Vietnam | −0.25 | South-Eastern Asia |
| 22 |  India India | −0.30 | Southern Asia |
| 23 |  Maldives Maldives | −0.34 | Southern Asia |
| =24 |  Sri Lanka Sri Lanka | −0.38 | Southern Asia |
| =24 |  Timor-Leste Timor-Leste | −0.38 | South-Eastern Asia |
| 26 |  Mongolia Mongolia | −0.49 | Eastern Asia |
| 27 |  Thailand Thailand | −0.53 | South-Eastern Asia |
| 28 |  Indonesia Indonesia | −0.54 | South-Eastern Asia |
| 29 |  Turkey Turkey | −0.56 | Western Asia |
| 30 |  Philippines Philippines | −0.58 | South-Eastern Asia |
| 31 |  Nepal Nepal | −0.63 | Southern Asia |
| 32 |  Uzbekistan Uzbekistan | −0.75 | Central Asia |
| 33 |  Azerbaijan Azerbaijan | −0.78 | Western Asia |
| 34 |  Laos Laos | −0.98 | South-Eastern Asia |
| 35 |  Pakistan Pakistan | −1.07 | Southern Asia |
| 36 |  Bangladesh Bangladesh | −1.10 | Southern Asia |
| 37 |  Kyrgyzstan Kyrgyzstan | −1.14 | Central Asia |
| 38 |  Iran Iran | −1.15 | Southern Asia |
| 39 |  Iraq Iraq | −1.21 | Western Asia |
| 40 |  Tajikistan Tajikistan | −1.22 | Central Asia |
| 41 |  Cambodia Cambodia | −1.23 | South-Eastern Asia |
| 42 |  Myanmar Myanmar | −1.25 | South-Eastern Asia |
| =43 |  Lebanon Lebanon | −1.30 | Western Asia |
| =43 |  Turkmenistan Turkmenistan | −1.30 | Central Asia |
| 45 |  Afghanistan Afghanistan | −1.31 | Southern Asia |
| 46 |  North Korea North Korea | −1.56 | Eastern Asia |
| 47 |  Yemen Yemen | −1.64 | Western Asia |
| 48 |  Syria Syria | −1.70 | Western Asia |
Territories and other places
Not ranked: dependencies of the states above, places whose status is disputed. Highest first.
Questions
- Which country in Asia has the best control of corruption?
- Singapore has the best control of corruption in Asia: an estimate of +1.97 (2024). Next come Bhutan (an estimate of +1.47) and Japan (an estimate of +1.36).
- Which country in Asia has the worst control of corruption?
- Syria, with an estimate of −1.70 (2024).
- What is the typical control of corruption of a country in Asia?
- The median of the 48 countries in Asia is an estimate of −0.38: half are above it, half below. The median, not the average, because a few countries at the top would drag an average far above almost everyone.
- Where do the figures come from?
- How well public power is kept from being used for private gain, petty or grand, as the World Bank’s Worldwide Governance Indicators estimate it from surveys and experts: about −2.5 (most corrupt) to +2.5 (least). Source: World Bank, 2024. Only independent states are ranked; territories are listed separately. A country’s continent follows Natural Earth; the handful of island states it files under the open ocean are placed by their UN subregion.
Source: World Bank (CC BY 4.0). Figures more than 5 years older than the newest are left out rather than shown beside current ones. Countries sharing a value share a rank. All sources.