Countries in Oceania by control of corruption
How well public power is kept from being used for private gain, petty or grand, as the World Bank’s Worldwide Governance Indicators estimate it from surveys and experts: about −2.5 (most corrupt) to +2.5 (least). 13 countries in Oceania, highest first. World Bank, 2024
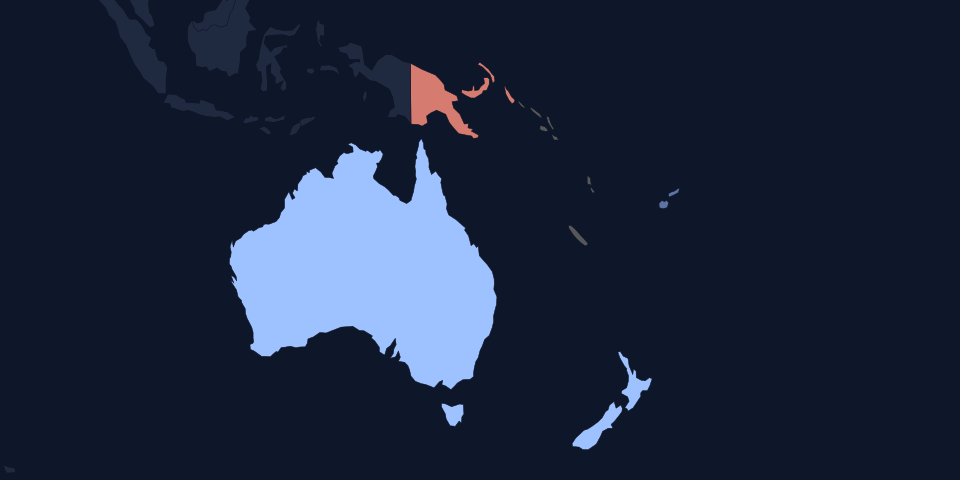
Median country
+0.50
half above, half below| # | Country | Estimate | Region |
|---|---|---|---|
| 1 |  New Zealand New Zealand | +1.93 | Australia and New Zealand |
| 2 |  Australia Australia | +1.85 | Australia and New Zealand |
| 3 |  Micronesia Micronesia | +0.71 | Micronesia |
| 4 |  Samoa Samoa | +0.69 | Polynesia |
| 5 |  Fiji Fiji | +0.56 | Melanesia |
| =6 |  Nauru Nauru | +0.50 | Micronesia |
| =6 |  Palau Palau | +0.50 | Micronesia |
| 8 |  Marshall Islands Marshall Islands | +0.39 | Micronesia |
| 9 |  Kiribati Kiribati | +0.37 | Micronesia |
| 10 |  Solomon Islands Solomon Islands | −0.14 | Melanesia |
| 11 |  Vanuatu Vanuatu | −0.15 | Melanesia |
| 12 |  Tonga Tonga | −0.40 | Polynesia |
| 13 |  Papua New Guinea Papua New Guinea | −0.80 | Melanesia |
Territories and other places
Not ranked: dependencies of the states above, places whose status is disputed. Highest first.
| Place | Estimate | Status |
|---|---|---|
 American Samoa American Samoa | +1.18 | Territory of United States of America |
 Guam Guam | +1.18 | Territory of United States of America |
 New Caledonia New Caledonia | +0.13 | Territory of France |
 French Polynesia French Polynesia | −0.21 | Territory of France |
Questions
- Which country in Oceania has the best control of corruption?
- New Zealand has the best control of corruption in Oceania: an estimate of +1.93 (2024). Next come Australia (an estimate of +1.85) and Micronesia (an estimate of +0.71).
- Which country in Oceania has the worst control of corruption?
- Papua New Guinea, with an estimate of −0.80 (2024).
- What is the typical control of corruption of a country in Oceania?
- The median of the 13 countries in Oceania is an estimate of +0.50: half are above it, half below. The median, not the average, because a few countries at the top would drag an average far above almost everyone.
- Where do the figures come from?
- How well public power is kept from being used for private gain, petty or grand, as the World Bank’s Worldwide Governance Indicators estimate it from surveys and experts: about −2.5 (most corrupt) to +2.5 (least). Source: World Bank, 2024. Only independent states are ranked; territories are listed separately. A country’s continent follows Natural Earth; the handful of island states it files under the open ocean are placed by their UN subregion.
Source: World Bank (CC BY 4.0). Figures more than 5 years older than the newest are left out rather than shown beside current ones. Countries sharing a value share a rank. All sources.