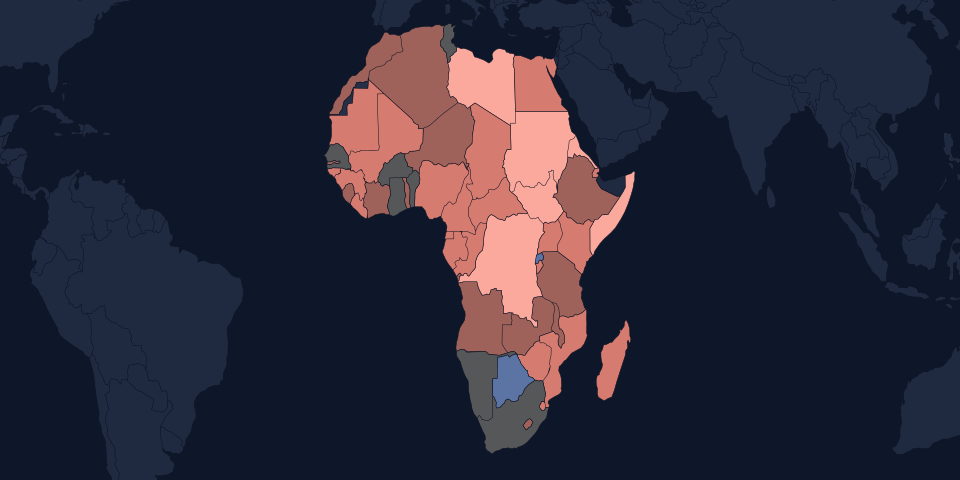
Countries in Africa by control of corruption
How well public power is kept from being used for private gain, petty or grand, as the World Bank’s Worldwide Governance Indicators estimate it from surveys and experts: about −2.5 (most corrupt) to +2.5 (least). 54 countries in Africa, highest first. World Bank, 2024
Median country
−0.80
half above, half below| # | Country | Estimate | Region |
|---|---|---|---|
| 1 |  Seychelles Seychelles | +1.23 | Eastern Africa |
| 2 |  Cabo Verde Cabo Verde | +0.94 | Western Africa |
| =3 |  Botswana Botswana | +0.63 | Southern Africa |
| =3 |  Rwanda Rwanda | +0.63 | Eastern Africa |
| 5 |  Mauritius Mauritius | +0.34 | Eastern Africa |
| 6 |  São Tomé and Principe São Tomé and Principe | +0.18 | Middle Africa |
| 7 |  Namibia Namibia | +0.13 | Southern Africa |
| 8 |  Senegal Senegal | +0.11 | Western Africa |
| =9 |  Ghana Ghana | −0.19 | Western Africa |
| =9 |  South Africa South Africa | −0.19 | Southern Africa |
| 11 |  Tunisia Tunisia | −0.22 | Northern Africa |
| 12 |  Benin Benin | −0.24 | Western Africa |
| 13 |  Burkina Faso Burkina Faso | −0.25 | Western Africa |
| =14 |  Côte d'Ivoire Côte d'Ivoire | −0.29 | Western Africa |
| =14 |  Tanzania Tanzania | −0.29 | Eastern Africa |
| 16 |  Lesotho Lesotho | −0.30 | Southern Africa |
| 17 |  Gambia Gambia | −0.33 | Western Africa |
| 18 |  Ethiopia Ethiopia | −0.44 | Eastern Africa |
| 19 |  Zambia Zambia | −0.46 | Eastern Africa |
| 20 |  Morocco Morocco | −0.52 | Northern Africa |
| 21 |  Algeria Algeria | −0.59 | Northern Africa |
| =22 |  Angola Angola | −0.62 | Middle Africa |
| =22 |  Niger Niger | −0.62 | Western Africa |
| 24 |  Malawi Malawi | −0.65 | Eastern Africa |
| 25 |  Togo Togo | −0.66 | Western Africa |
| 26 |  Sierra Leone Sierra Leone | −0.70 | Western Africa |
| 27 |  Eswatini Eswatini | −0.79 | Southern Africa |
| 28 |  Kenya Kenya | −0.80 | Eastern Africa |
| 29 |  Egypt Egypt | −0.83 | Northern Africa |
| 30 |  Djibouti Djibouti | −0.89 | Eastern Africa |
| 31 |  Mauritania Mauritania | −0.93 | Western Africa |
| 32 |  Gabon Gabon | −0.94 | Middle Africa |
| 33 |  Mali Mali | −0.98 | Western Africa |
| 34 |  Madagascar Madagascar | −1.01 | Eastern Africa |
| 35 |  Liberia Liberia | −1.05 | Western Africa |
| 36 |  Mozambique Mozambique | −1.06 | Eastern Africa |
| 37 |  Nigeria Nigeria | −1.11 | Western Africa |
| 38 |  Uganda Uganda | −1.12 | Eastern Africa |
| 39 |  Comoros Comoros | −1.14 | Eastern Africa |
| 40 |  Guinea Guinea | −1.17 | Western Africa |
| 41 |  Cameroon Cameroon | −1.22 | Middle Africa |
| 42 |  Zimbabwe Zimbabwe | −1.25 | Eastern Africa |
| 43 |  Central African Republic Central African Republic | −1.31 | Middle Africa |
| 44 |  Guinea-Bissau Guinea-Bissau | −1.35 | Western Africa |
| 45 |  Chad Chad | −1.39 | Middle Africa |
| 46 |  Congo Congo | −1.42 | Middle Africa |
| 47 |  Burundi Burundi | −1.46 | Eastern Africa |
| 48 |  Equatorial Guinea Equatorial Guinea | −1.47 | Middle Africa |
| 49 |  DR Congo DR Congo | −1.52 | Middle Africa |
| 50 |  Libya Libya | −1.53 | Northern Africa |
| 51 |  Sudan Sudan | −1.56 | Northern Africa |
| 52 |  Eritrea Eritrea | −1.63 | Eastern Africa |
| 53 |  Somalia Somalia | −1.79 | Eastern Africa |
| 54 |  South Sudan South Sudan | −2.06 | Eastern Africa |
Questions
- Which country in Africa has the best control of corruption?
- The Seychelles has the best control of corruption in Africa: an estimate of +1.23 (2024). Next come Cabo Verde (an estimate of +0.94) and Botswana (an estimate of +0.63).
- Which country in Africa has the worst control of corruption?
- The South Sudan, with an estimate of −2.06 (2024).
- What is the typical control of corruption of a country in Africa?
- The median of the 54 countries in Africa is an estimate of −0.80: half are above it, half below. The median, not the average, because a few countries at the top would drag an average far above almost everyone.
- Where do the figures come from?
- How well public power is kept from being used for private gain, petty or grand, as the World Bank’s Worldwide Governance Indicators estimate it from surveys and experts: about −2.5 (most corrupt) to +2.5 (least). Source: World Bank, 2024. Only independent states are ranked; territories are listed separately. A country’s continent follows Natural Earth; the handful of island states it files under the open ocean are placed by their UN subregion.
Source: World Bank (CC BY 4.0). Figures more than 5 years older than the newest are left out rather than shown beside current ones. Countries sharing a value share a rank. All sources.