Countries in Africa by foreign investment
Net inflows of foreign direct investment — foreigners buying or building lasting stakes in companies — as a share of GDP. Below zero, more was withdrawn than came in. 52 countries in Africa, highest first. World Bank, mostly 2024
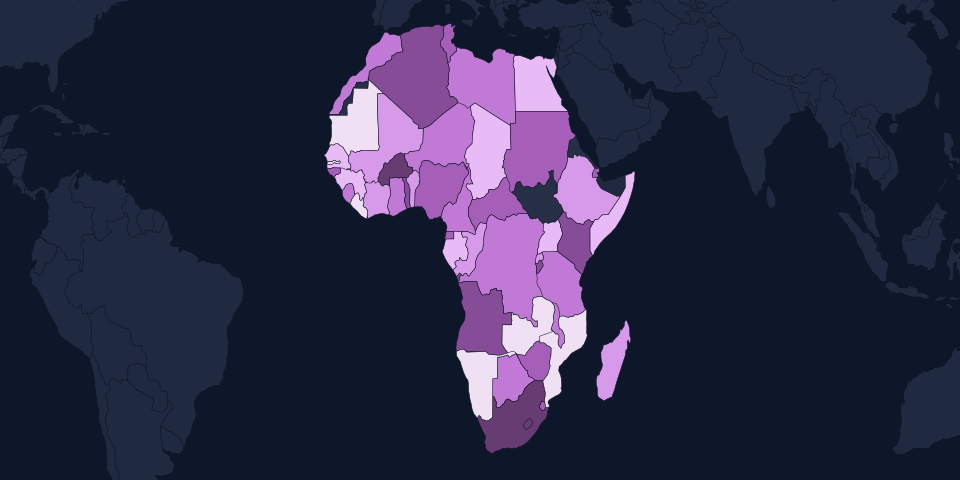
Median country
2.2%
half above, half below| # | Country | % of GDP | Year | Region |
|---|---|---|---|---|
| 1 |  Mozambique Mozambique | 15.4% | 2024 | Eastern Africa |
| 2 |  Namibia Namibia | 14.2% | 2024 | Southern Africa |
| 3 |  Mauritania Mauritania | 13.2% | 2024 | Western Africa |
| 4 |  Seychelles Seychelles | 10.1% | 2024 | Eastern Africa |
| 5 |  Liberia Liberia | 9.9% | 2024 | Western Africa |
| 6 |  Gambia Gambia | 9.7% | 2024 | Western Africa |
| 7 |  Zambia Zambia | 9.3% | 2024 | Eastern Africa |
| 8 |  Somalia Somalia | 6.4% | 2024 | Eastern Africa |
| 9 |  Senegal Senegal | 6.3% | 2024 | Western Africa |
| 10 |  Uganda Uganda | 6.0% | 2024 | Eastern Africa |
| 11 |  Guinea Guinea | 5.6% | 2024 | Western Africa |
| 12 |  Gabon Gabon | 5.5% | 2024 | Middle Africa |
| 13 |  Chad Chad | 5.1% | 2024 | Middle Africa |
| 14 |  Cabo Verde Cabo Verde | 5.0% | 2025 | Western Africa |
| 15 |  Mauritius Mauritius | 4.6% | 2024 | Eastern Africa |
| 16 |  Egypt Egypt | 4.2% | 2025 | Northern Africa |
| =17 |  Congo Congo | 3.8% | 2024 | Middle Africa |
| =17 |  Rwanda Rwanda | 3.8% | 2024 | Eastern Africa |
| 19 |  Côte d'Ivoire Côte d'Ivoire | 3.6% | 2024 | Western Africa |
| =20 |  Madagascar Madagascar | 3.4% | 2024 | Eastern Africa |
| =20 |  Mali Mali | 3.4% | 2024 | Western Africa |
| 22 |  Ethiopia Ethiopia | 2.7% | 2024 | Eastern Africa |
| 23 |  Benin Benin | 2.5% | 2024 | Western Africa |
| 24 |  Botswana Botswana | 2.4% | 2024 | Southern Africa |
| 25 |  Malawi Malawi | 2.3% | 2024 | Eastern Africa |
| 26 |  Tanzania Tanzania | 2.2% | 2024 | Eastern Africa |
| 27 |  DR Congo DR Congo | 2.1% | 2025 | Middle Africa |
| =28 |  Libya Libya | 1.8% | 2023 | Northern Africa |
| =28 |  Morocco Morocco | 1.8% | 2025 | Northern Africa |
| =28 |  Niger Niger | 1.8% | 2024 | Western Africa |
| =31 |  Cameroon Cameroon | 1.7% | 2024 | Middle Africa |
| =31 |  Ghana Ghana | 1.7% | 2025 | Western Africa |
| =31 |  Sierra Leone Sierra Leone | 1.7% | 2024 | Western Africa |
| =34 |  Djibouti Djibouti | 1.6% | 2024 | Eastern Africa |
| =34 |  Eswatini Eswatini | 1.6% | 2024 | Southern Africa |
| =36 |  Central African Republic Central African Republic | 1.5% | 2024 | Middle Africa |
| =36 |  Tunisia Tunisia | 1.5% | 2024 | Northern Africa |
| =38 |  Equatorial Guinea Equatorial Guinea | 1.4% | 2024 | Middle Africa |
| =38 |  Nigeria Nigeria | 1.4% | 2025 | Western Africa |
| =38 |  Sudan Sudan | 1.4% | 2023 | Northern Africa |
| 41 |  Guinea-Bissau Guinea-Bissau | 1.2% | 2024 | Western Africa |
| 42 |  Zimbabwe Zimbabwe | 1.1% | 2024 | Eastern Africa |
| 43 |  Burundi Burundi | 1.0% | 2025 | Eastern Africa |
| 44 |  Angola Angola | 0.9% | 2025 | Middle Africa |
| 45 |  Togo Togo | 0.8% | 2024 | Western Africa |
| 46 |  Algeria Algeria | 0.5% | 2024 | Northern Africa |
| =47 |  Comoros Comoros | 0.4% | 2024 | Eastern Africa |
| =47 |  Kenya Kenya | 0.4% | 2024 | Eastern Africa |
| 49 |  Lesotho Lesotho | -0.2% | 2025 | Southern Africa |
| 50 |  South Africa South Africa | -0.5% | 2025 | Southern Africa |
| 51 |  Burkina Faso Burkina Faso | -0.9% | 2024 | Western Africa |
| 52 |  São Tomé and Principe São Tomé and Principe | -2.0% | 2024 | Middle Africa |
No World Bank figure for 2 countries: Eritrea, South Sudan.
Questions
- Which country in Africa has the most foreign investment for the size of its economy?
- Mozambique has the most foreign investment for the size of its economy in Africa: 15.4% of GDP (2024). Next come Namibia (14.2% of GDP) and Mauritania (13.2% of GDP).
- Which country in Africa has the least foreign investment for the size of its economy?
- São Tomé and Principe, with -2.0% of GDP (2024).
- What is the typical foreign investment of a country in Africa?
- The median of the 52 countries in Africa is 2.2% of GDP: half are above it, half below. The median, not the average, because a few countries at the top would drag an average far above almost everyone.
- Where do the figures come from?
- Net inflows of foreign direct investment — foreigners buying or building lasting stakes in companies — as a share of GDP. Below zero, more was withdrawn than came in. Source: World Bank, mostly 2024. Only independent states are ranked; territories are listed separately. A country’s continent follows Natural Earth; the handful of island states it files under the open ocean are placed by their UN subregion.
Source: World Bank (CC BY 4.0). Figures more than 5 years older than the newest are left out rather than shown beside current ones. Countries sharing a value share a rank. All sources.