Countries in North America by precipitation
Average rain and snow in a year over the whole country, in millimetres — a long-term average, not one year’s weather. 23 countries in North America, highest first. World Bank, 2022
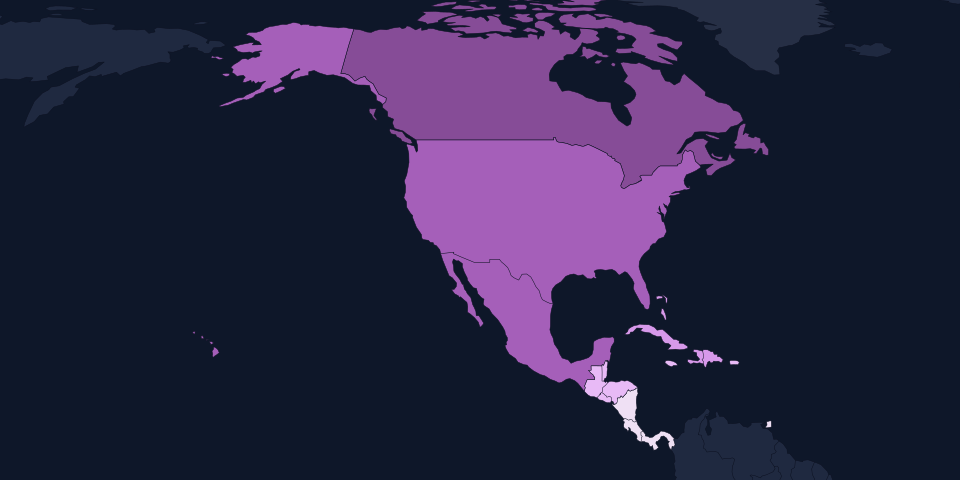
Median country
1,705
half above, half below| # | Country | mm a year | Region |
|---|---|---|---|
| 1 |  Panama Panama | 2,928 | Central America |
| 2 |  Costa Rica Costa Rica | 2,926 | Central America |
| 3 |  Grenada Grenada | 2,350 | Caribbean |
| 4 |  Saint Lucia Saint Lucia | 2,301 | Caribbean |
| 5 |  Nicaragua Nicaragua | 2,280 | Central America |
| 6 |  Trinidad and Tobago Trinidad and Tobago | 2,200 | Caribbean |
| 7 |  Dominica Dominica | 2,083 | Caribbean |
| 8 |  Jamaica Jamaica | 2,051 | Caribbean |
| 9 |  Guatemala Guatemala | 1,996 | Central America |
| 10 |  Honduras Honduras | 1,976 | Central America |
| 11 |  El Salvador El Salvador | 1,784 | Central America |
| 12 |  Belize Belize | 1,705 | Central America |
| 13 |  Saint Vincent and the Grenadines Saint Vincent and the Grenadines | 1,583 | Caribbean |
| 14 |  Haiti Haiti | 1,440 | Caribbean |
| 15 |  Saint Kitts and Nevis Saint Kitts and Nevis | 1,427 | Caribbean |
| 16 |  Barbados Barbados | 1,422 | Caribbean |
| 17 |  Dominican Republic Dominican Republic | 1,410 | Caribbean |
| 18 |  Cuba Cuba | 1,335 | Caribbean |
| 19 |  Bahamas Bahamas | 1,292 | Caribbean |
| 20 |  Antigua and Barbuda Antigua and Barbuda | 1,030 | Caribbean |
| 21 |  Mexico Mexico | 758 | Central America |
| 22 |  United States United States | 715 | Northern America |
| 23 |  Canada Canada | 537 | Northern America |
Territories and other places
Not ranked: dependencies of the states above, places whose status is disputed. Highest first.
| Place | mm a year | Status |
|---|---|---|
 Puerto Rico Puerto Rico | 2,054 | Territory of United States of America |
Questions
- Which country in North America has the most rain and snow?
- Panama has the most rain and snow in North America: 2,928 mm a year (2022). Next come Costa Rica (2,926 mm a year) and Grenada (2,350 mm a year).
- Which country in North America has the least rain and snow?
- Canada, with 537 mm a year (2022).
- What is the typical precipitation of a country in North America?
- The median of the 23 countries in North America is 1,705 mm a year: half are above it, half below. The median, not the average, because a few countries at the top would drag an average far above almost everyone.
- Where do the figures come from?
- Average rain and snow in a year over the whole country, in millimetres — a long-term average, not one year’s weather. Source: World Bank, 2022. Only independent states are ranked; territories are listed separately. A country’s continent follows Natural Earth; the handful of island states it files under the open ocean are placed by their UN subregion.
Source: World Bank (CC BY 4.0). Figures more than 10 years older than the newest are left out rather than shown beside current ones. Countries sharing a value share a rank. All sources.