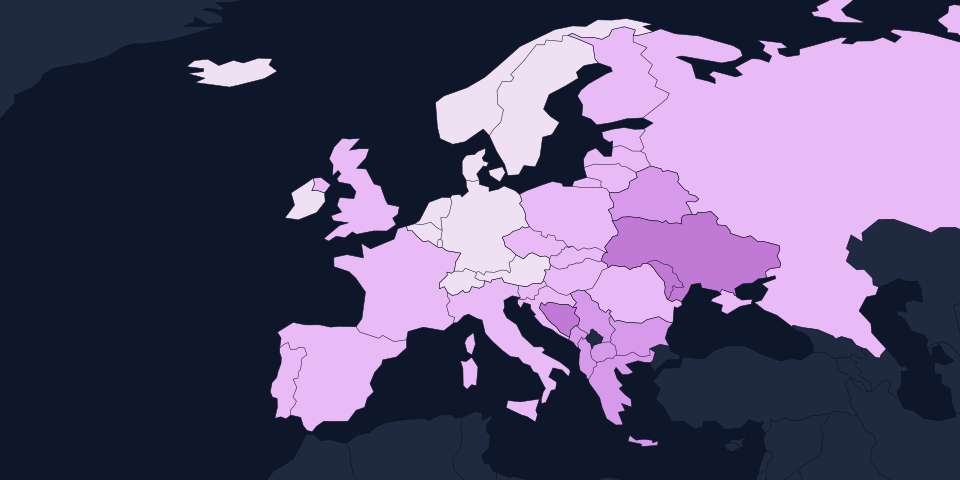
Countries in Europe by gdp per capita (ppp)
Gross domestic product per person in international dollars: converted at purchasing power parity, so a dollar buys as much everywhere and cheap countries are not made to look poorer than they live. 41 countries in Europe, highest first. World Bank, mostly 2025
Median country
$59,245
half above, half below| # | Country | Int. $ per person | Year | Region |
|---|---|---|---|---|
| 1 |  Luxembourg Luxembourg | $156,542 | 2025 | Western Europe |
| 2 |  Ireland Ireland | $155,089 | 2025 | Northern Europe |
| 3 |  Norway Norway | $104,044 | 2025 | Northern Europe |
| 4 |  Switzerland Switzerland | $102,513 | 2025 | Western Europe |
| 5 |  Netherlands Netherlands | $87,320 | 2025 | Western Europe |
| 6 |  Iceland Iceland | $83,431 | 2025 | Northern Europe |
| 7 |  Denmark Denmark | $83,218 | 2025 | Northern Europe |
| 8 |  Andorra Andorra | $79,567 | 2025 | Southern Europe |
| 9 |  San Marino San Marino | $78,810 | 2023 | Southern Europe |
| 10 |  Austria Austria | $76,778 | 2025 | Western Europe |
| 11 |  Germany Germany | $75,407 | 2025 | Western Europe |
| 12 |  Belgium Belgium | $74,676 | 2025 | Western Europe |
| 13 |  Sweden Sweden | $72,529 | 2025 | Northern Europe |
| 14 |  Malta Malta | $72,210 | 2025 | Southern Europe |
| 15 |  Finland Finland | $65,884 | 2025 | Northern Europe |
| 16 |  United Kingdom United Kingdom | $64,606 | 2025 | Northern Europe |
| 17 |  France France | $63,975 | 2025 | Western Europe |
| 18 |  Italy Italy | $62,803 | 2025 | Southern Europe |
| 19 |  Czechia Czechia | $60,487 | 2025 | Eastern Europe |
| 20 |  Spain Spain | $59,868 | 2025 | Southern Europe |
| 21 |  Slovenia Slovenia | $59,245 | 2025 | Southern Europe |
| 22 |  Lithuania Lithuania | $56,838 | 2025 | Northern Europe |
| 23 |  Poland Poland | $54,262 | 2025 | Eastern Europe |
| 24 |  Portugal Portugal | $53,146 | 2025 | Southern Europe |
| 25 |  Estonia Estonia | $52,106 | 2025 | Northern Europe |
| 26 |  Croatia Croatia | $50,946 | 2025 | Southern Europe |
| 27 |  Romania Romania | $50,895 | 2025 | Eastern Europe |
| 28 |  Hungary Hungary | $49,838 | 2025 | Eastern Europe |
| 29 |  Russia Russia | $49,568 | 2025 | Eastern Europe |
| 30 |  Slovakia Slovakia | $49,309 | 2025 | Eastern Europe |
| 31 |  Latvia Latvia | $46,137 | 2025 | Northern Europe |
| 32 |  Greece Greece | $45,264 | 2025 | Southern Europe |
| 33 |  Bulgaria Bulgaria | $44,451 | 2025 | Eastern Europe |
| 34 |  Montenegro Montenegro | $35,423 | 2025 | Southern Europe |
| 35 |  Belarus Belarus | $34,716 | 2025 | Eastern Europe |
| 36 |  Serbia Serbia | $33,910 | 2025 | Southern Europe |
| 37 |  Albania Albania | $28,221 | 2025 | Southern Europe |
| 38 |  North Macedonia North Macedonia | $28,029 | 2025 | Southern Europe |
| 39 |  Bosnia and Herzegovina Bosnia and Herzegovina | $25,814 | 2025 | Southern Europe |
| 40 |  Moldova Moldova | $19,996 | 2025 | Eastern Europe |
| 41 |  Ukraine Ukraine | $18,905 | 2025 | Eastern Europe |
No World Bank figure for 3 countries: Liechtenstein, Monaco, Vatican City.
Territories and other places
Not ranked: dependencies of the states above, places whose status is disputed. Highest first.
| Place | Int. $ per person | Status |
|---|---|---|
 Faroe Islands Faroe Islands | $82,089 | Territory of Denmark |
Questions
- Which country in Europe has the highest GDP per capita (PPP)?
- Luxembourg has the highest GDP per capita (PPP) in Europe: $156,542 a person (2025). Next come Ireland ($155,089 a person) and Norway ($104,044 a person).
- Which country in Europe has the lowest GDP per capita (PPP)?
- Ukraine, with $18,905 a person (2025).
- What is the typical gdp per capita (ppp) of a country in Europe?
- The median of the 41 countries in Europe is $59,245 a person: half are above it, half below. The median, not the average, because a few countries at the top would drag an average far above almost everyone.
- Where do the figures come from?
- Gross domestic product per person in international dollars: converted at purchasing power parity, so a dollar buys as much everywhere and cheap countries are not made to look poorer than they live. Source: World Bank, mostly 2025. Only independent states are ranked; territories are listed separately. A country’s continent follows Natural Earth; the handful of island states it files under the open ocean are placed by their UN subregion.
Source: World Bank (CC BY 4.0). Figures more than 5 years older than the newest are left out rather than shown beside current ones. Countries sharing a value share a rank. All sources.