Countries in Europe by income inequality (gini)
The Gini index of household income or consumption: 0 if everyone had the same, 100 if one household had everything. Household surveys are rare in some countries, so figures up to ten years old are shown. 39 countries in Europe, highest first. World Bank, mostly 2023
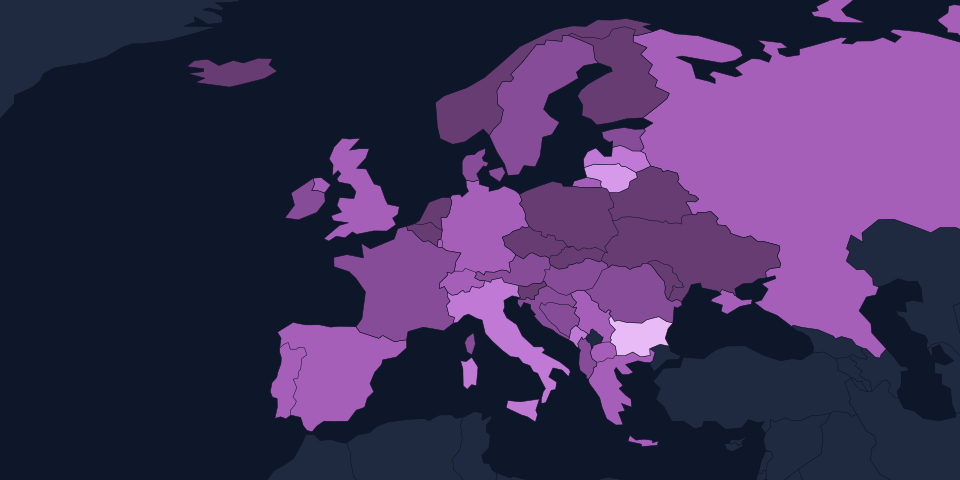
Median country
30.6
half above, half below| # | Country | Gini | Year | Region |
|---|---|---|---|---|
| 1 |  Bulgaria Bulgaria | 39.5 | 2023 | Eastern Europe |
| 2 |  Lithuania Lithuania | 36.0 | 2023 | Northern Europe |
| =3 |  Italy Italy | 34.3 | 2023 | Southern Europe |
| =3 |  Montenegro Montenegro | 34.3 | 2021 | Southern Europe |
| 5 |  Latvia Latvia | 34.0 | 2023 | Northern Europe |
| 6 |  Portugal Portugal | 33.9 | 2023 | Southern Europe |
| 7 |  Switzerland Switzerland | 33.8 | 2022 | Western Europe |
| 8 |  Germany Germany | 33.7 | 2022 | Western Europe |
| 9 |  Luxembourg Luxembourg | 33.6 | 2023 | Western Europe |
| 10 |  North Macedonia North Macedonia | 33.5 | 2019 | Southern Europe |
| =11 |  Greece Greece | 33.4 | 2023 | Southern Europe |
| =11 |  Spain Spain | 33.4 | 2023 | Southern Europe |
| 13 |  Russia Russia | 33.0 | 2023 | Eastern Europe |
| 14 |  Serbia Serbia | 32.8 | 2023 | Southern Europe |
| 15 |  United Kingdom United Kingdom | 32.4 | 2021 | Northern Europe |
| =16 |  France France | 31.8 | 2023 | Western Europe |
| =16 |  Malta Malta | 31.8 | 2023 | Southern Europe |
| 18 |  Austria Austria | 31.2 | 2023 | Western Europe |
| 19 |  Estonia Estonia | 30.7 | 2023 | Northern Europe |
| 20 |  Hungary Hungary | 30.6 | 2017 | Eastern Europe |
| 21 |  Bosnia and Herzegovina Bosnia and Herzegovina | 30.3 | 2021 | Southern Europe |
| 22 |  Croatia Croatia | 30.1 | 2023 | Southern Europe |
| 23 |  Denmark Denmark | 29.9 | 2023 | Northern Europe |
| 24 |  Romania Romania | 29.8 | 2023 | Eastern Europe |
| 25 |  Albania Albania | 29.4 | 2020 | Southern Europe |
| 26 |  Sweden Sweden | 29.3 | 2023 | Northern Europe |
| 27 |  Ireland Ireland | 29.0 | 2023 | Northern Europe |
| 28 |  Poland Poland | 28.5 | 2023 | Eastern Europe |
| 29 |  Finland Finland | 27.4 | 2023 | Northern Europe |
| =30 |  Belgium Belgium | 26.8 | 2023 | Western Europe |
| =30 |  Iceland Iceland | 26.8 | 2019 | Northern Europe |
| =30 |  Moldova Moldova | 26.8 | 2023 | Eastern Europe |
| 33 |  Norway Norway | 26.5 | 2023 | Northern Europe |
| =34 |  Czechia Czechia | 25.7 | 2023 | Eastern Europe |
| =34 |  Netherlands Netherlands | 25.7 | 2021 | Western Europe |
| 36 |  Ukraine Ukraine | 25.6 | 2020 | Eastern Europe |
| 37 |  Slovenia Slovenia | 24.7 | 2023 | Southern Europe |
| 38 |  Belarus Belarus | 24.4 | 2020 | Eastern Europe |
| 39 |  Slovakia Slovakia | 23.8 | 2023 | Eastern Europe |
No World Bank figure for 5 countries: Andorra, Liechtenstein, Monaco, San Marino, Vatican City.
Questions
- Which country in Europe has the most unequal incomes?
- Bulgaria has the most unequal incomes in Europe: a Gini index of 39.5 (2023). Next come Lithuania (a Gini index of 36.0) and Italy (a Gini index of 34.3).
- Which country in Europe has the most equal incomes?
- Slovakia, with a Gini index of 23.8 (2023).
- What is the typical income inequality (gini) of a country in Europe?
- The median of the 39 countries in Europe is a Gini index of 30.6: half are above it, half below. The median, not the average, because a few countries at the top would drag an average far above almost everyone.
- Where do the figures come from?
- The Gini index of household income or consumption: 0 if everyone had the same, 100 if one household had everything. Household surveys are rare in some countries, so figures up to ten years old are shown. Source: World Bank, mostly 2023. Only independent states are ranked; territories are listed separately. A country’s continent follows Natural Earth; the handful of island states it files under the open ocean are placed by their UN subregion.
Source: World Bank (CC BY 4.0). Figures more than 10 years older than the newest are left out rather than shown beside current ones. Countries sharing a value share a rank. All sources.